Tuesday, February 27, 2018

System 2 Turtle Trading by Dennis Richard on SNAP

I am trying to experiment a new setup based from the turtle trading system of Dennis Richard as written by Michael W. Covel in his book "The Complete Turtle Trader"

System 2 setup is based on the New 55days High. If a stock hits new 55 days high, you enter on the following day no matter what price the stock is in. Your exit strategy is based on 4 weeks new low. If the stock goes against your traded trend, then exit with a loss on the New 20days low.

SNAP posted a very good quarter and is getting good revenue. Feb 7, 2018 it had a surge volume with a very long candle breaking a new 55 days high, reaching 21.22 surpassing former high of 16.88 of the past 55 days. I initiated and order of 18.75 on the 2nd day days and another order of 18.65 on the 3rd day. Now is the 13th day and the stock is still posting a new low of 16.3 lower than the low of the breakout candle with the low of 16.96.

Current Volatility based on ATR = Average True Range is 1.63

My take here is that if the slide continues to make new low until 20th day, then I will exit the positions at a loss, based on the exit strategy of Richard Dennis on his System 2 of Turtle Trading. Then we will wait for possible reversal again.


Monday, February 19, 2018

Using Finviz to mine small CAP stocks that are performing well

Finviz.com is one of the online tool you can use in data mining for possible investment opportunity. If you use the filter very well to your advantage, there is a big chance that you can always end up with very good results.

To use Finviz, it doesn't need to have a paid membership. You can sign up for free with finviz.com. Although if you want to get more advance data you can sign-up with their paid membership accounts. In my case, I just used the free ones. And this filter I am going to show today is about mining for small cap that can give you good return. After signing up with finviz. Go to finviz.com and click the "Screener" Menu. Click the tab named "All". This will show all the filter for Descriptive, Fundamentals and Technical. Set your filters based on our rule below, then set your viewing preference to "Snapshot". This will give you a quick overview of the company and the figures we are looking for.

We will try to follow fundamental rules that will guide us how we can find what we are looking for.
The following 1st 5 rules are based on the book of Ian Wyatt titled "The Small Cap Investor". 

The #6 Rule is based on the Turtle trading by Richard Dennis and William Echardt in the book 'The complete turtle trader" written by, Michael C. Covel p.109. The rule is looking for stocks that had reached new 55 day high. Since Finviz has only 50Day High. This is what we use as filter.

Rule #7 and #8 are based from Mark Minervini's book "Trade Like a Stock Market Wizard". Mark had been a very good player in the stock market and had made good amount of money in stocks using his VCP "Volatility Contraction Pattern" method out of the stocks that had gone up already and whose price is above the 200 Day Simple Moving Average (SMA) and whose 50 Day SMA is above the 200SMA.

Rule #9 and #10 are based on the liquidity of the Market. You want to make sure that when you buy there are a lot of volumes, at least 200K and above shares. And when you want to dispose it, there are also a of possible buyers who want to take it from you.

  1. It should be in the Small Capitalisation group. Around $300milion to $2billion of capitalisation.
  2. Earnings per share (EPS) growth for the last 5 years should be above 20%
  3. EPS growth for the next five years is expected to be more than 20%
  4. EPS for this year should also be more than 20%.
  5. EPS for next year is expected also to be more than 20%
  6. 50Day High/Low = New High.
  7. 200 Day SMA = Price above 200SMA
  8. 50 Day SMA = 50Day SMA is above 200Day SMA
  9. Average Volume = Over 200K 
  10. Current Volume = Over 200K
With these rules we can use for filtering we should be able to find the best small cap stock we need to invest with.


The filter yielded us the company ticker "NMIH". It is a mortgage Holding Company whose Earnings per share this year is posting 322.20% and projected EPS next year is 44.12%. EPS Q/Q (Quarter per quarter  is 90.50% and Sales Q/Q is 39.8%. Everything seemed to be green on this ticker.

Now we will go to bigcharts.com to help us check the P/E history of this company. With bigcharts.com you don't need to sign up in order to use the charting. I used the Advanced Chart because I can plot the Volume + Bollinger Bands, Simple Moving Averages and P/E Ratio. One of the rule of Mark Minervini is that the P/E ratio should be going higher. In fact he is advocating for at least a ratio of 30. In this example we have a growing P/E ratio but not yet 30. It is rising though. 


After that initial High Volume of more than 10Million P/E ratio had been slowly increasing from 11 to 15. 


Friday, February 16, 2018

New 55 Day High based on Turtle Trading by Richard Dennis

The following are the patterns to look for in Turtle trading using the principles and rules of Richard Dennis and William Eckhardt based from the book "The Complete Turtle Trader" written by Michael C. Covel

Using the Stockfetcher I created the following filter to extract the pattern we are looking for that can generate 60% to 300% gain in 3 months time.

/*NEW 55 DAY HIGH
This Filter was created as part of Rule# 1 in following the Turtle trading
by Richard Dennis and Willian Eckhardt in the book "The Complete Turtle Trader."
written by Michael C. Covel p.109*/
Show stocks where close reached a new 55 Day high
and price between $1 and $19
and Volume > 200000
Chart-time 2 years 

I fetched the stocks on the current date: Feb 16, 2018 then on the date filter I chose 3 months ago to give me the scenario of stocks captured. I sorted the result based on the Performance and this is what came up.

Based on the extract. It seemed that the highest gain are those that have the price remaining almost flat the entire year before the breakout like BUDZ, EMHTF and ACBFF. The remaining 3 COLL, MFIN and CBAY have based channels of volatility before the breakout. The first 3 also were Over The Counter Bulletin Board Stocks (OTCBB) or Pink Stocks. While the other 3 were NASDAQ stocks. 

Using this filter and finding stocks with this pattern, enter after the breakout. This is the 55 day breakout that Dennis Richard  advocated to his turtle traders. Ride with the trend then let the price guide you. If it starts to reverse, liquidate.


Wednesday, February 7, 2018

MINOLA Patterns to look for

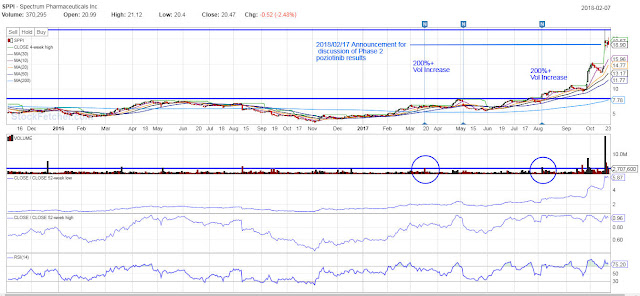
SPPI Pattern

1 Year Period
6 months Period
SPPI ON THE NEWS: Jan. 17, 2018 SPPI announced the discussion of Phase 2 Development of poziotinib product for cancer patients. The next day, the volume of SPPI went surging.
 After such surge, the price keep bouncing back and forth forming and island channel. This maybe waiting for another surge of volume and will push itself up.

LLIT
1 Year Period

Monday, February 5, 2018

Minervine - O'Neil - Larry or Minola Watchlist 2018-02-05

Stockfetcher extract from my 200% plus volume gainer:


Symbol
Last
Chg(%)
 Vol
RMI(10,1)
RSI(14)
EYES
2.34
14.15
   8,313,173.00
78.04
72.27
AFMD
2.6
38.67
   6,994,575.00
88.7
83.27
VKTX
6.1
0.49
   4,622,752.00
71.91
69.94
CAPR
1.9
-0.52
   3,530,519.00
56.65
55.7
APRI
2.25
1.35
   2,751,612.00
44.26
48.49
MIII
9.96
0
   1,434,567.00
57.09
57.82
MNOV
9.37
-1.58
       793,287.00
72.21
70.96
FUND
7.78
-2.02
       322,602.00
24.36
30.86
LLIT
2.24
8.21
       302,057.00
82.34
78.86
MATR
2.75
-3.51
       276,485.00
46.3
49.5

EYES. There is a squeeze on the price by both end of the channels of the bollinger bands. Williams%R(10) is still close to median. Maybe another thrust is coming upward. Although P/E ratio is heading lower. The sentiment of buying is not that great. The volume is high but price experienced halg of its  half of its run being sold out.  

APRI. Not only the stock price is trending higher but also the P/E ratio is trending higher. William %R(10) is in divergence with P/E ratio. There is a small squeeze on the Bollinger bands that  may signal that the stock is currently in the pullback state ready for another take off.

LLIT. No P/E Ratio. Williams %R(10) is on the upper channel. Pullback is likely to come.

VKTX


Thursday, February 1, 2018

F-Pattern Breakout - Pullback Entry at Prior Volume High

HTGM
This is an example of a breakout with volume more than double its previous high volume. The stock broke the 200SMA (orange line) and the previous high of $3.00 which failed last Nov. 8, 2017. The stock is due for a bounce since it had been consolidating for the last 2 months (10 weeks). After hitting that $3.00 mark it failed and dived to as low as 1.71 then resurfaced to $2.00 pulled back twice below $2.00 and went supernova up to $4.00. 

The question is. How to play this kind of move? What I usually do with this kind of move is to check the previous volume against the highest volume. I will trace the candle that belongs to that volume previous volume and find the neckline of that candle. In this case the neckline is $2.81. I will then use that $2.81 as a point of entry for my play. I will place a buy order at this line and once hit I will let it stay until the $4.00 mark is almost hit and sell the shares. In this case, from 1.81 to 4.00 you have a gain of $1.19. More or less $1.00 gain 10 to 11 days of trading. 

CNET
What is the difference with this kind of breakout from the previous one? Here, there is no way you can see the previous volume. This is too much Supernova, which is pretty hard to play, unless you short it instead. Advice: Do not play this kind of stock.

NOTE: All these stocks were captured in the stockfetcher filter I created called "200Percen Spike in Volume". The filter extracts the stocks that surge in volume of more than 200% against the average volume. And here the list last Jan 4, 2017 which I filtered to stocks that had changed 20% and above.
To avail the services of stockfetcher, you just need to get a monthly or quarterly subscriptions with them. I used the subscription via itunes with my ipad so I can use the stockfetcher app on my ipad as well. The code behind the filter is the following:

/* 200% Spike in Volume */
show stocks where volume is more than 200% above average volume(30) 1 day ago
and price between 1 and 10
and draw MA(10)        
and draw MA(20)                         
and draw MA(50)
and draw MA(200)
and price above MA(200)
and current volume > 200000
and Market is NASDAQ

I limit the filter to pick up only the NASDAQ stocks. I fyou want to include NYSE and other exchanges, just remove the line: "and Market is NASDAQ"
I prefer NASDAQ stocks because they are big movers in just a small span of time.

CCXI
Here's another F Pattern breakout with more than 200% surge of Volume. You can enter with a buy order in the same principle as with HTGM or you wait for candle formation with long tail and use the end of the tail as your buy order entry. Here, the buy order entry would be around $8.00 then sell it once the top wick of the candle whose volume had surge more than 200%. In this case, the sell price should be around 9.45 or take it at 9.25 to 9.35.

HOW DO I CHECK IF THESE STOCKS ARE GOOD PLAY?
I always counter check the list against finviz filter so that way I can gauge if the stocks are worthy of placing my money in. There are 4 filters I liked to incorporate in counter-checking the play:
  1. EPS Growth quarter over quarter under Fundamental tab of finviz. This filter should be set to Positive (>0%).
  2. Sales growth quarter over quarter under Fundamental tab of finviz. This filter should also be set to Positive (>0%).
  3. Under Technical tab. Price should be above the 50 Day Simple moving Average.
  4. Under the technical tab again, the Price should be above SMA200 or 200-Day Simple Moving Average.
To be able to avail this service with finviz, just sign up for free at https://finviz.com/


Minervini - O'Neal - Larry Williams Combined Strategy

MINOLA LIST forming an F Pattern based on Fous 4 Strategy.

AKER
AKG
AUO
AVEO
DNR
HTGM
MYO

PDS
RUN


STOCKS TO WATCH ON CANNABIS

STOCKS TO WATCH ON CANNABIS

  1. WEED
  2. APH
  3. NUU
  4. CMED

More on Different kind of Trading: Vol High - Prior Vol High Stock Entry - Case on CONL (Granite Shares Trust Granite Shares 2x LON)

CHART: CONL (Granite Shares Trust Granite Shares 2x LON) http://charts.stockfetcher.com/sfchart/OeSm5wo7tZ.png https://www.tradingview.com/x...