Thursday, January 2, 2020

New 78 Day High Offset

This is the bare New 78 Day High with other filtration removed. If you want to incorporate this in your own stockfetcher filter, you can copy the script below.

/*Start of SCRIPT*/
symlistsymlist()
Show stocks where close reached New 78 Day High
and volume is more than 200% above average volume(30) 1 day ago
And Price between .1 and 30
And Market is not OTCBB
and add column RMI(10,1)
and add column RSI(^SPX,90)
and add column ADX(14)
and add column Average True Range(14)
and add column Open
and add column High
and add column Low
and add column Close
and do not draw EMA(18)
and draw EMA(30)
and draw EMA(10)
and do not draw EMA(20)
and draw EMA(50)
and do not draw MA(50)
and do not draw MA(100)
and do not draw EMA(100)
and do not draw MA(200)
and draw EMA(200)
and do not draw Close of New 78 day High
/*and ADX(14) > 30                                L.Williams like 30 with Price touching MA(20)*/
/*A couple of bells and whistles for back testing*/
set{entry, close}
set{target, entry * 1.10}
set{ stop, entry * 0.95}
draw price line at entry
draw price line at target
draw price line at stop
/*End of SCRIPT*/

Shorting Opportunity on N78 + Darvas on confirmed Double top

I was just looking for a possible play today with stockfetcher using my filter "New 78 - Darvas Day High"

Sometimes, it takes a while for a certain stock to be able to propel again after hitting a double top, although it had been confirmed on a previous move to have a solid N78 with Darvas box strength rise. When this occasion arises you have a short period of shorting opportunity. This is the case of the following:

VNRX - Volition RX Ltd.

http://charts.stockfetcher.com/sfchart/AlW62hWlzj.png
In a 2 years span the stock seemed to have a pretty good move upward. In fact it is actually respecting the 200EMA (200 days exponential moving average) starting from January of 2019, using it as its support all the way up. And as you can see too the stock price kept bouncing on a high (red line upward) and low channel (blue line upward) going upward.

http://charts.stockfetcher.com/sfchart/w0CqfSnJ8f.png
Sep. 24, 2019 it hits New 78 Day
Sep. 25, 2019 it hits New 78 Day High + Darvas
Sep. 26, 2019 to Oct. 3, 2019 in 6 days the entire gain of Sep. 25, 2019
                       was wiped out with low volume.

http://charts.stockfetcher.com/sfchart/o9BnPOwaj8.png
Sep. 25-27, 2019 Marked the shooting star formation
Oct. 21, 2019 18 days after the Darvas formation it tried to breakout of 6.20 but couldn't
                       It got hammered on Oct. 22, 2019 and closing around $5.65 below the close of $5.77
Oct. 28, 2019 Double top is confirmed. It just couldn't get through the $6.00 mark.

http://charts.stockfetcher.com/sfchart/bG7rZkz9Qy.png
The top of Sep. 25, 2019 and the tops of Oct. 21 and Oct. 28, 2019 created a major resistance (see light red rectangle) . This somewhat like a $0.50 cents resistance bold line (Between $6.50 and $6.00). This kind of confirmation would tell you that it will take a while before the stock can propel back to break out this resistance. It has to swing low first and create a momentum.

The close of Oct. 28, 2019 is a trigger point for shorting. If you position a short on this level you can be rewarded slowly but surely.


If we short on such level, where could be our cover position? Now we have to retrace our volumes.
http://charts.stockfetcher.com/sfchart/SupDyNd9x4.png
The major highest volume was on Sep. 24, 2019 when it made a New 78 Day High (see volume with yellow circle dated 2019/09/24). Before this volume the highest prior volume next to it looking through the left side by projecting a horizontal line against the body of this breakout volume would be the prior volume in Sep. 17, 2019 (See volume circled with yellow and dated 2019/09/17). If you trace the candle of that prior volume, the low of the candle was around $3.90. Your cover would be around $3.95 then, 5 cents higher than this low. This is also your reversal positioning for a buy order.

http://charts.stockfetcher.com/sfchart/8iJG3xkUrw.png
The cover of the short position is hit on Dec. 5, 2019 which is triggered the buy position. At this scenario the price drop is being supported now by the 200EMA.

http://charts.stockfetcher.com/sfchart/X7lJryJga8.png
Looking at the 2year chart the higher lows of the candles from Dec. 5 - 19 of 2019 where all ascending following the 200EMA. Also the candle on Dec. 5, 2019 had a longer tail which means that there is now a bit of a stronger push upward. The ascending higher low prices are now well aligned on the ascending lower blue channel, which gives you confirmation of possible reversal from its pullback.


New 78 - Darvas Day High (filter for stockfetcher)

This is the filter that use combining the strength of New 78 Day High and Darvas Box. I named the filter "New 78 - Darvas Day High" and the script below is what extract the type of stock I am looking for.

If you want copy this script and build it into your stockfetcher filter, just copy the following:

/*START OF SCRIPT*/
/*New 78 Day High with Darvas Box*/
symlistsymlist()
Set{hi52w, high 52 week high}
Set{lo52w, low 52 week low}
Set{hi/lo-Ratio, hi52w / lo52w}
SET{X, ATR(20) / CLOSE}
SET{ATR%,X * 100}

Show stocks where close reached New 78 Day High
and price is near the 7 year high
and volume is more than 400% above average volume(365) 1 day ago
and AvgVol(20) is above 250000 /*Tweaked the AvgVol from 100K to 250K to match Trading Ninja*/
and volume is above 50000
AND hi/lo-Ratio IS GREATER THAN 1.85
And Price between .1 and 30

and comparative relative strength(^SPX,90) is above .99
and do not draw comparative relative strength(^SPX,90)
and compare with ^SPX
and chart-length is 2 years


And Market is not OTCBB
and add column RMI(10,1)
and add column RSI(^SPX,90)
and add column ADX(14,30)
and add column Average True Range(14)
and add column Open
and add column High
and add column Low
and add column Close
and add column AvgVol(20)
and add column high 7 year high
and add column ma(30)
and add column ATR(20)
and add column ATR%
and add column hi/lo-Ratio
and add column industry description
AND DRAW DARVAS BOX

and do not draw EMA(18)
and draw EMA(20)
and draw EMA(10)
and do not draw EMA(30)
and draw EMA(50)
and do not draw MA(50)
and do not draw MA(100)
and do not draw EMA(100)
and do not draw MA(200)
and draw EMA(200)
and do not draw Close of New 78 day High
and draw ADX(14,30)
/*and ADX(14) > 30                                L.Williams like 30 with Price touching MA(20)*/
/*A couple of bells and whistles for back testing*/
set{entry, close}
set{target, entry * 1.10}
set{ stop, entry * 0.95}
draw price line at entry
draw price line at target
draw price line at stop
/*END OF SCRIPT*/


Sunday, December 15, 2019

New 78 Day High with Wall Street Trophy on ARWR and ARQL


From: Jerome Noel <njnltd@gmail.com>
Date: Tue, Oct 29, 2019 at 9:48 PM
Subject: ARWR/ARQL N78 Day High and Darvas Box Breakout + Trophies (Russel 2000 & SP600)
To: Accelotrade students
  1. Did you remember the lesson I gave you last Jun 2019 when Toronto Raptors won the game?
    https://youtu.be/oSQMne65bdE  
    See Section 46:20
    I mentioned that like Toronto Raptors ARWR had been handed down by Wall Street a trophy for being a very good company by adding it on S&P 600, and ARQL had been awarded this trophy as well for being a good company adding it to Russel 2000.

    Had you ever followed it up when it was still $29.00 you could have gained a lot of money already. Look at the chart below with the current Price level at $39.90

  2. It did not go down as far as $22.00 as anticipated. 
  3. But it bypassed that support and pushed the price higher to $36.50. This is where the shake up happened.
  4. Then it pulled back on to the lower side of the channel for support and went down to $25.95. 
  5. From there it rebounded and hit $39.90. That's an impressive move.

Please review the video lesson and start studying charts based on the patterns I have shown you.Maybe you still have the shot for ARQL if you missed ARWR.

Cheers and have a good night guys.

Jerome

**********************************************************

On Tue, Dec 10, 2019 at 9:53 AM Jerome Noel <njnltd@gmail.com> wrote:
Guys had you reviewed my video, you will be in for a treat today.

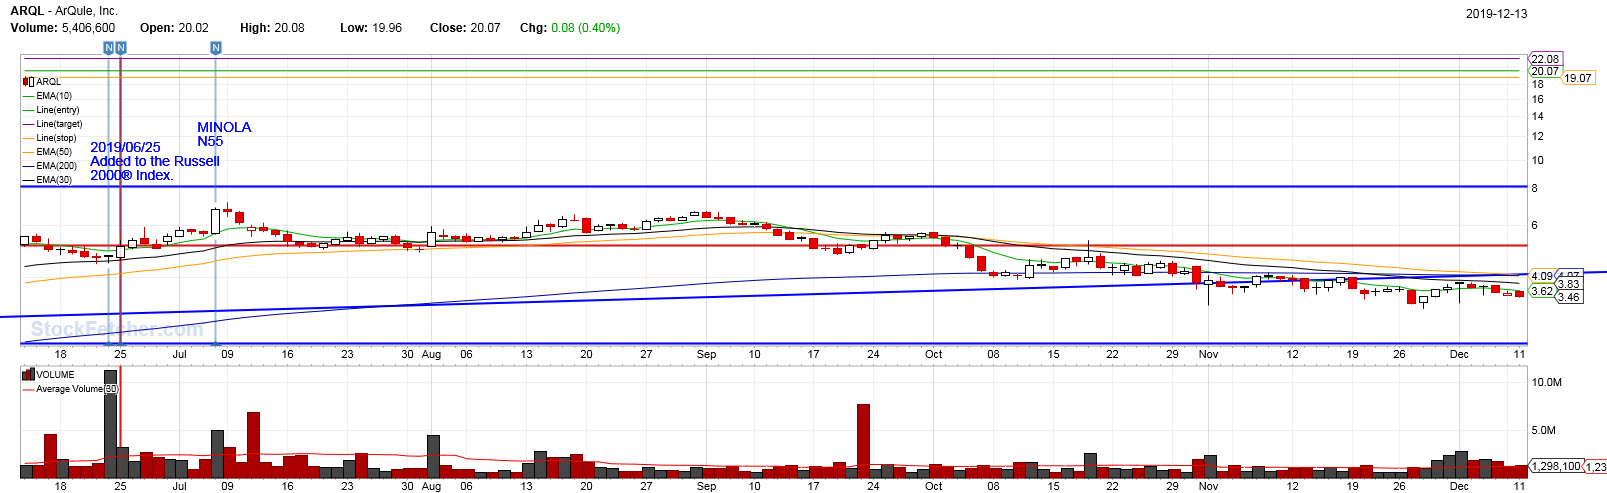
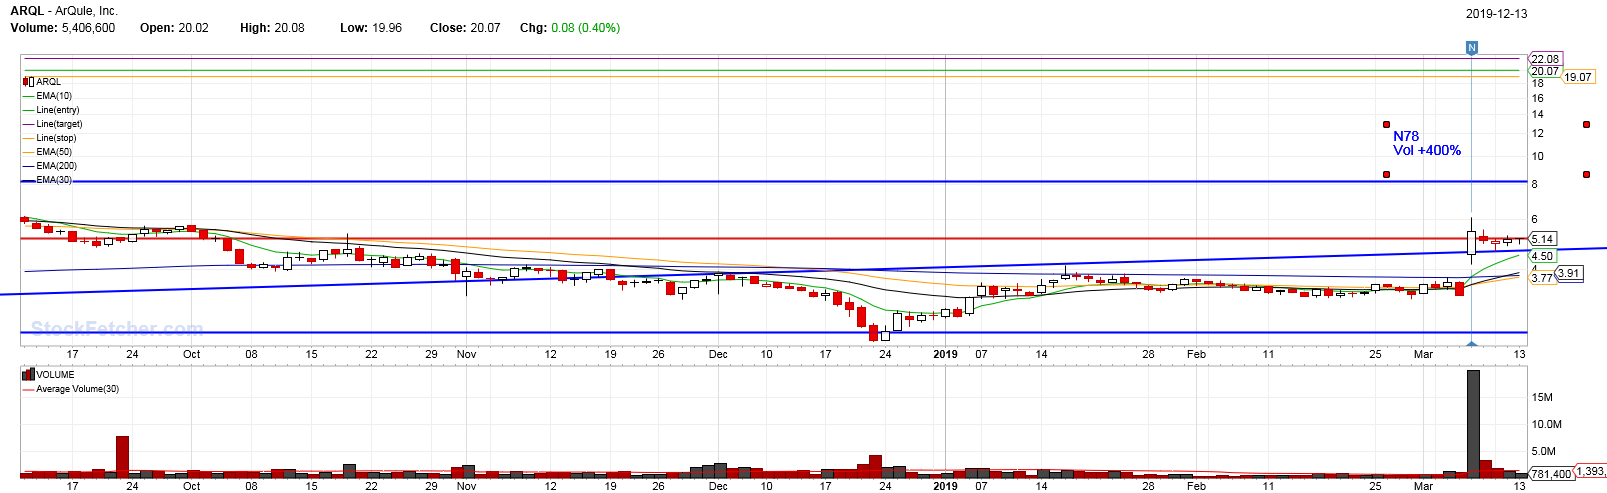
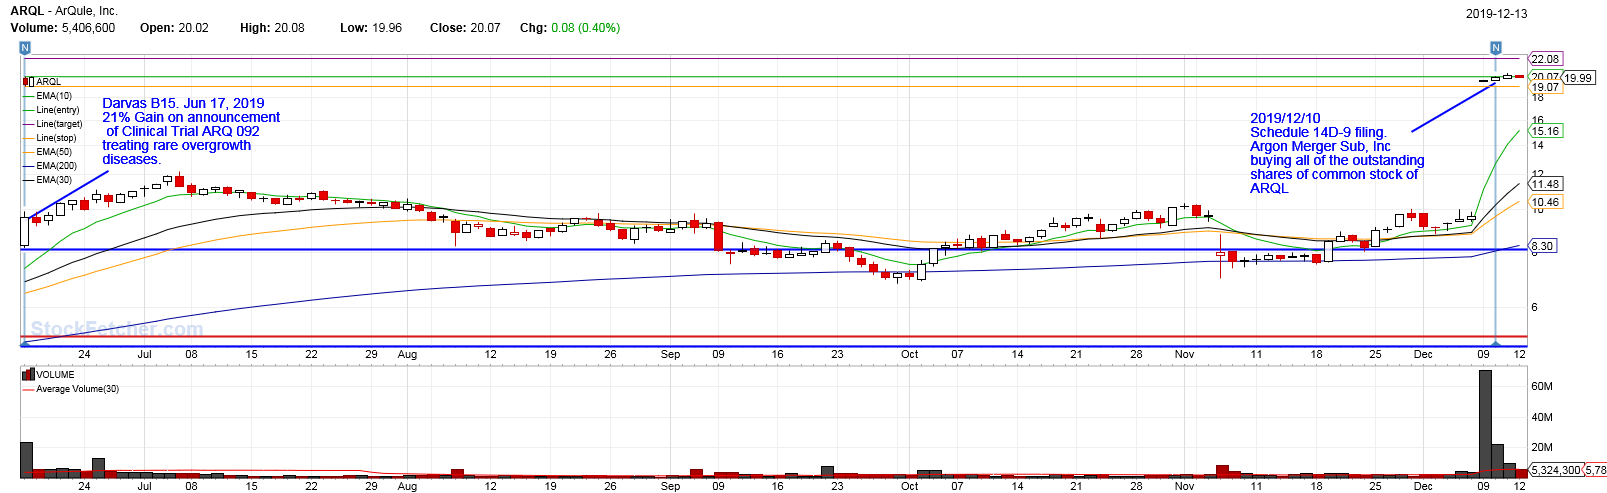
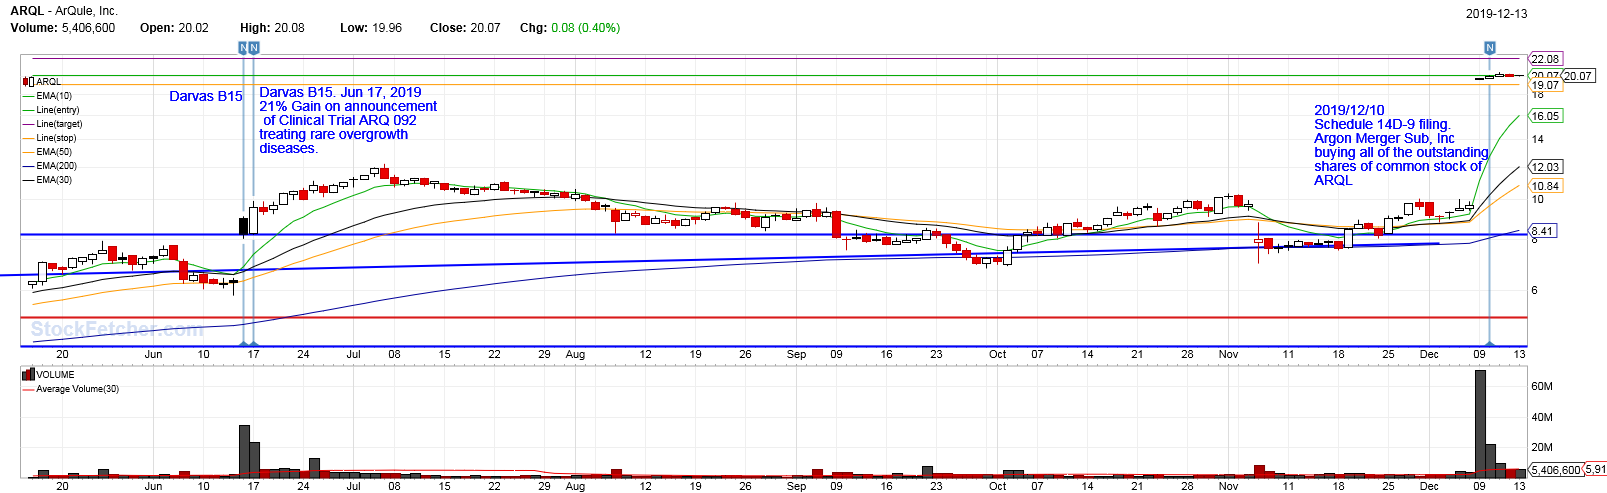
ARQL just skyrocketed yesterday from the close of 9.66 on Dec. 6, 2019 to a high 19.73 and today is hovering at a high of 20.10.

Remember I told you to watch the video and watch out for these 2 stocks (ARWR and ARQL). They had been awarded with trophies of being good companies by Wall Street. 

These were the words I said to you:
 "Please review the video lesson and start studying charts based on the patterns I have shown you.Maybe you still have the shot for ARQL if you missed ARWR."

Cheers and have a good one.

Jerome

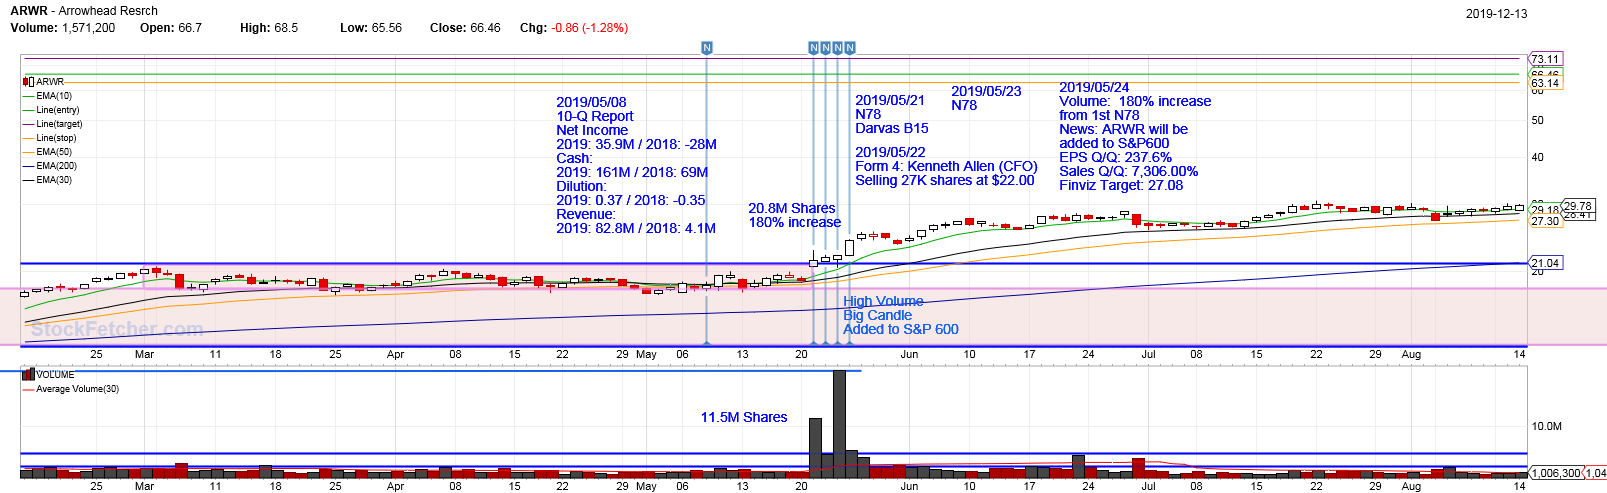
ARWR Historical Chart:
http://charts.stockfetcher.com/sfchart/BF2izin3Ep.png

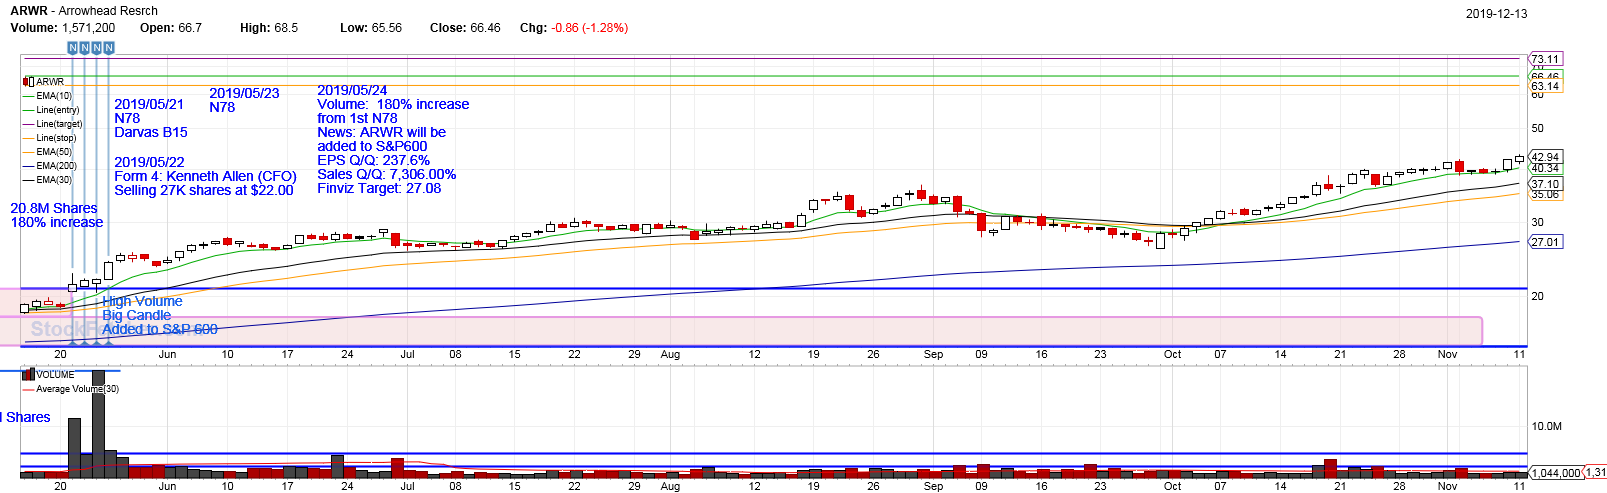
This is ARWR as of Nov. 11, 2019
http://charts.stockfetcher.com/sfchart/ho6isN0COt.png

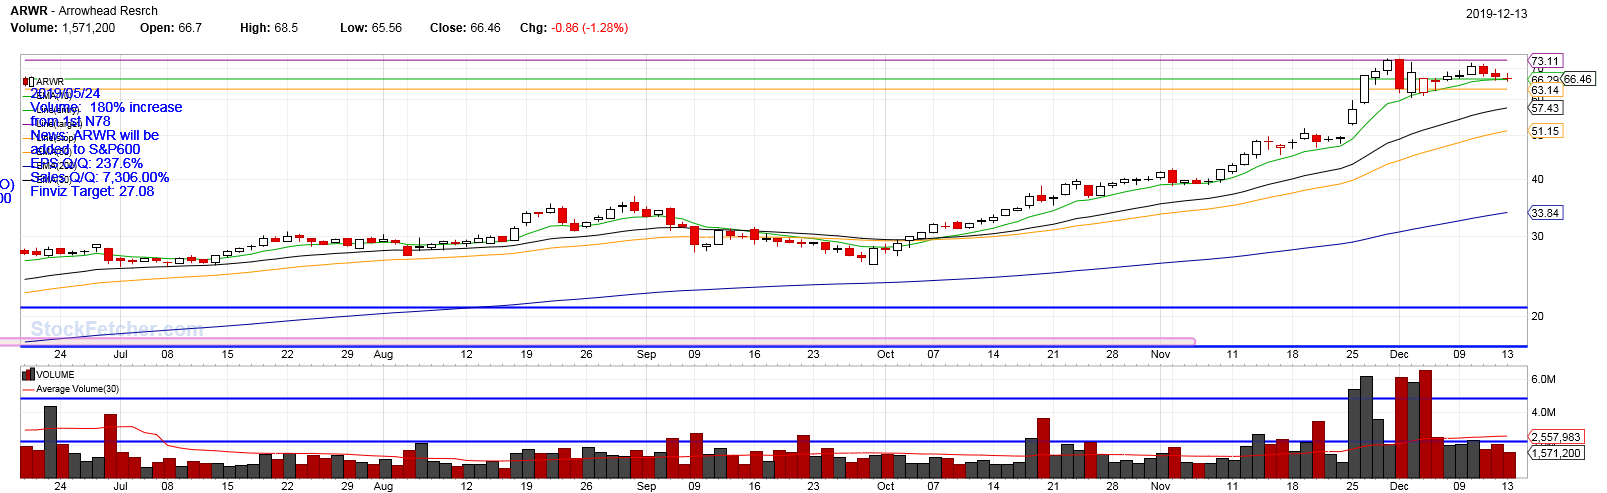
This is ARWR as of Dec. 13, 2019
http://charts.stockfetcher.com/sfchart/mksy8XiZV9.png


ARQL historical chart:
Aug. 21, 2018
http://charts.stockfetcher.com/sfchart/bumBao5X3A.png

Dec. 11, 2018
http://charts.stockfetcher.com/sfchart/1a9yWPqZkz.png

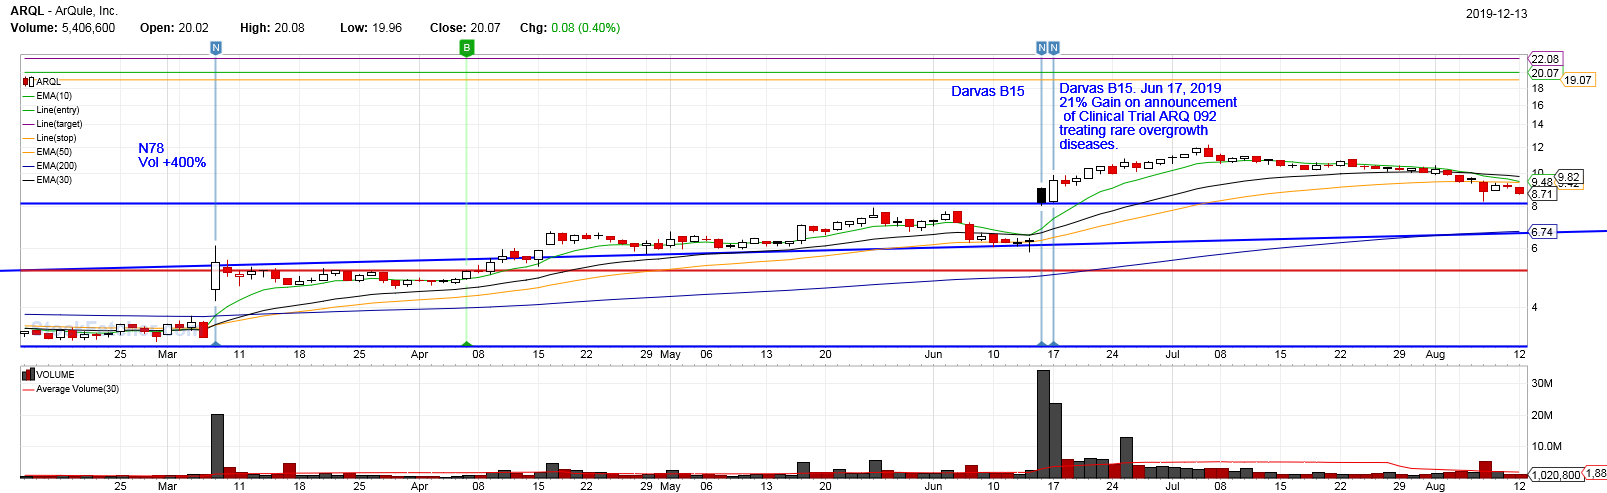
Mar. 13, 2019
http://charts.stockfetcher.com/sfchart/C08oHtzlhK.png


Aug. 12, 2019
http://charts.stockfetcher.com/sfchart/lqZ6we4VmR.png

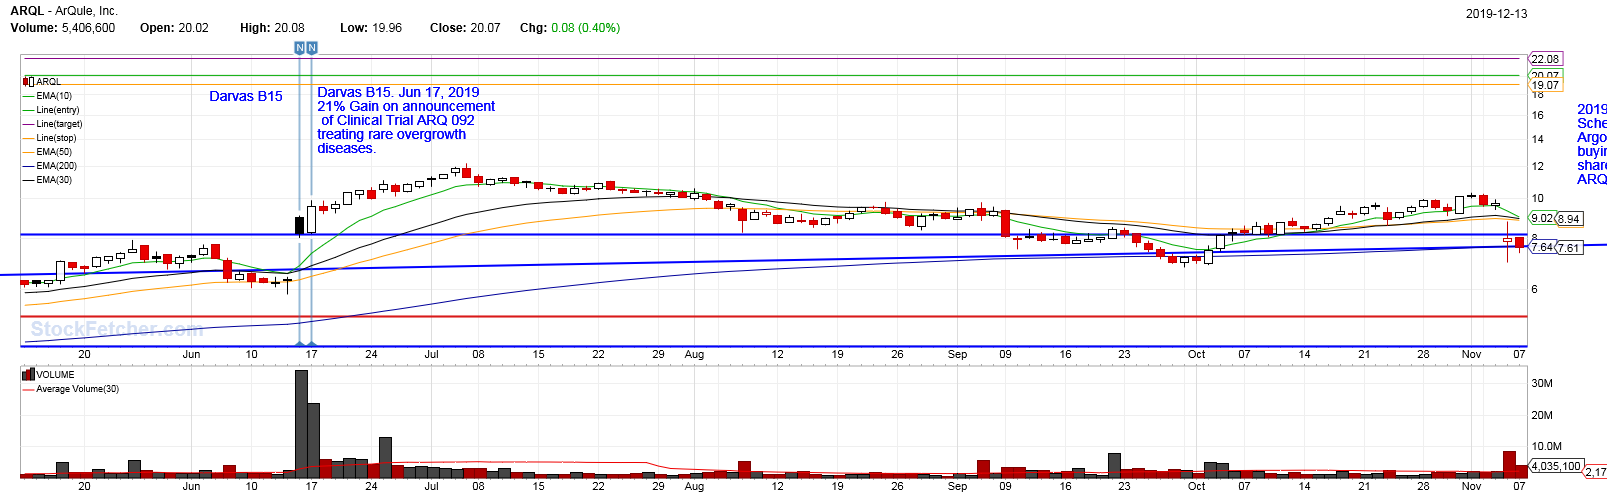
Nov. 7, 2019
http://charts.stockfetcher.com/sfchart/HJf2kZ5qpm.png

Dec. 12, 2019
http://charts.stockfetcher.com/sfchart/fRptiRm21C.png


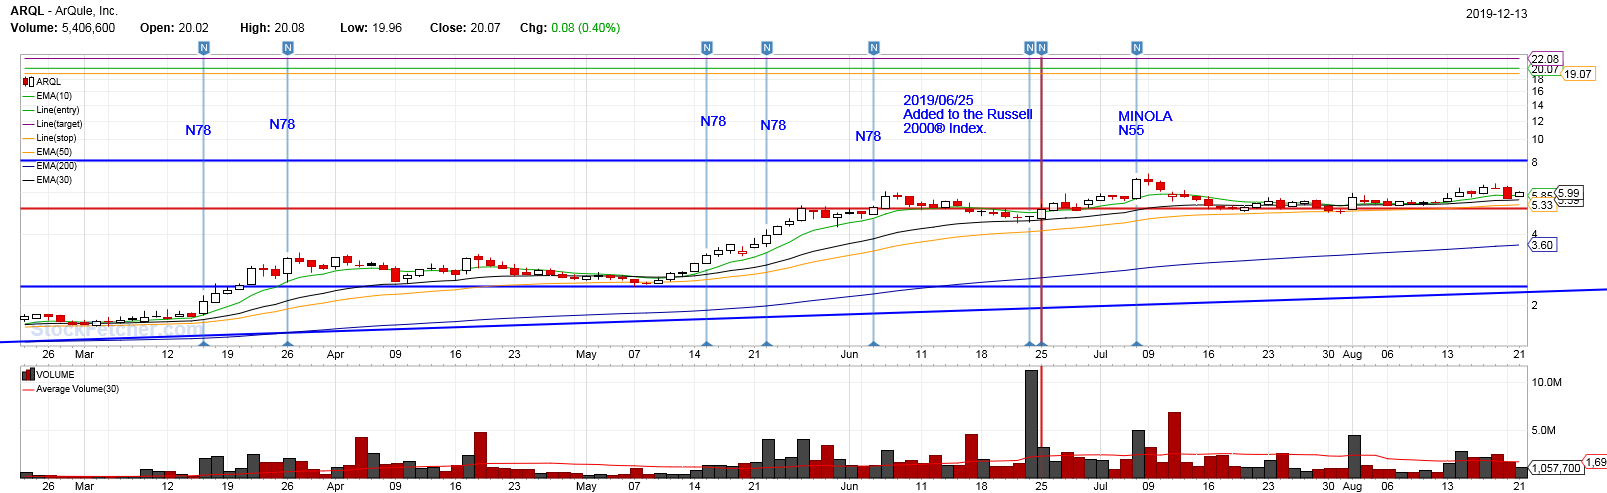
This is ARQL as of Dec. 15, 2019
http://charts.stockfetcher.com/sfchart/5Tbedmu2WX.png
Now, based on this result of ARQL, I would like you to start looking for the reason of why stock is making a New 78 Day High. If the reason has something to do with being listed into a higher Wall Street qualifications, you are in for a treat. Start collecting stocks like these ARWR and ARQL and you can't go wrong.


Friday, December 6, 2019

Crisscrossing of 3 and 8 Exponential Moving Average - A buy trigger on New 78 Day High

Moving Averages especially the exponential one is very potent when you are able to combine its strength along with other scenarios.

In this practicum try to learn to set-up the EMA crosses on Accelotrade Chart so you can easily decipher a good pattern similar to what I am showing you.

The crisscrossing of 3 and 8 ema can become your buy trigger when the following conditions are met:

 1. These 2 smaller emas are right above the 30, 50 and 200 EMAs
 2. A New 78 Day High had occurred accompanied with heavy volume
 3. The 30 and the 50 EMA had crossed above the 200EMA

Try to look for these set-up using data from Stockfetcher's New 78 Day High Offset.


In the example, the current date on stockfetcher is Dec. 5, 2019. Placing an offset of 66 days, resulting data in table would fetch stocks with New 78 Day Highs occurring on Sep. 3, 2019. If you have a different current date just adjust the number of days offset accordingly.


Take 5 stocks from this list and Practice them on Accelotrade Practice Mode with Open Date reset on Sep. 3, 2019.


Visit Accelotrade Academy on youtube to learn this set-up.
https://youtu.be/ZtujhP4SKe4
And please subscribe on this channel so you get notifications with the new videos being uploaded. 

Cheers and have a good one.

Thursday, August 29, 2019

XPEL - New 78 Day High - Good Revenue, Income and Cash - De-listing at TSXV and registration with NASDAQ

XPEL ANALYSIS, August 29, 2019

XPEL last August 21, 2019 appeared on our stockfetcher New 78 Day High. This prompted me to go deeper in checking out this ticker symbol.

When I looked at Finviz of what XPEL was, the description is merely an automotive company that produce and manufactures automotive products. After careful investigation I found out that they were not just manufacturer of automotive spare parts. They specialize on investment protection for vehicles. This company creates and innovates special protection devices for automobile and trucks. In their website XPEL.COM they mentioned that they use cutting-edge products described as self-healing technology in protecting automobiles.

Yahoo finance reported XPEL's Second Quarter Revenue highlighting a revenue of $30.1M with improved gross margin of 35.3%.

If we follow our 1 kick cycle in Trading the steps to follow are:

  1. Investigate: the chart, fundamentals, market sentiment
  2. Calculate: the target price
  3. Weight: the Risks and Reward using the Target Price and Stop Loss
  4. Execute: the trade
  5. Repeat: the cycle.
Steps 1 to 3 is planning the trade.
Step 4 is trading the plan.
Step 5 Repeating the cycle.

So let us follow the steps and apply it with XPEL. In the case of this blog, we will tackle only Steps 1 to 3 and it is up to you to continue on Step 4 and 5.

A. INVESTIGATE: 

We will investigate its chart for technical analysis, then its fundamentals if the bullish move will have the breath of pumping up the price to a higher level. Then we also investigate the sentiment of the market.

XPEL'S CHART using Tradingview.com (Showing its listing with NASDAQ to voluntary de-listing with Toronto Stock Exchange Ventures (TSXV) until August 29, 2019.

XPEL's chart with Mutiple Top Breakout


XPEL's CHART using BigCharts.com (This is 1 decade span - monthly candlestick chart)

KEY OBSERVATIONS based from the 3 charts:
  1. Sep. 18, 2013 huge volume of 517K with price peaking at a high of $1.30
  2. March 31, 2015 560 days after that huge volume the price reached to a high of $6.12. A significant gain of $4.82 from #1. It was a gain of 360%.
  3. The March 31, 2015 run pulled back on the same day from a high of $6.12 to a low of $2.94
  4. The slide to $2.94 continued until Jan. 11, 2016 (287 days after) up to the bottom of $0.64. This is a -89% drop from $6.12 which is equivalent to -$5.48.
  5. It gained $4.82 from the 1st high volume then dropped $5.48 on small volumes. As a tiny company you could expect this kind of manipulation. I think Market Maker saw that there are big pocket Investors lining up to get a share of the pie. These big guys they only buy at a discounted price but on volumes. The only way, the Market Maker can satisfy their hunger is to shake the tree and let the weak hands to surrender their shares. 
  6. From the drop to $0.60 the price slowly stabilized creating a volatility contraction of its price in smaller volumes until a break-out occurred and price surpassed $6.12 which retested at $4.00 then broke out the former high and reaching $8.55 on Aug. 21, 2019 
  7. Look at XPEL's chart on Tradingview.com. On April 3, 2019, XPEL listed itself on NASDAQ. The price surged to a high of $7.20, although it also went as low as $4.81 with just 150K shares of volume. Take note of this height, because this is the height of which it will create a new breakout.
  8. The low on April 3, 2019 served as the base until it broke out of 200EMA (yellow-orange line). Then the top of $7.20 served as the breakout point to a new high when it had a large volume on August 21, 2019. 
  9. From Aug. 30, 2018 to August 21, 2019, XPEL made 4 Tops or Multiple Top Breakout on a a huge volume. This is a signal of a strong Bullish Move.
  10. Current price is touching the upper line of the Price Channel. So there is a tendency that we will be seeing pullback that would make the price touch on the lower channel. This is where you must be prepared to take on XPEL.
ANALYSIS:
If at first 500K it added $4.82 and now it made another 500K + of Volume, then let us assume that it will just add the same amount, then the 8.55 could somehow easily go to $13.37 before pulling back the price -$5.46 lower, which would then come out at a price level of $7.91. 
This analysis is based on its historical move. As history repeats itself, then there is a great probability that it will follow the same pattern. If the secondary volume that may occur after these 500K new volume would result to a bullish volume with a  gap-up on its price then we could probably see our Target Price of $19.67 to be likely hit.

Review the move of SPPI from August 4, 2017 to Oct. 18, 2017 and you will find similarity of this move from XPEL.


INVESTIGATE THE FUNDAMENTALS:

Looking up XPEL with otcmarkets.com and checking its Disclosures we found interesting stuff.
  1. 10-12B was filed 2019-04-03. This is the listing of XPEL with NASDAQ.
  2. 8-K filed 2019-08-16 voluntary de-listing of XPEL from Toronto Stock Exchange Ventures.
  3. 10-Q filed August 21, 2019 showed the following financial report.


SUMMARY OF 2019-08-21 10Q (2019 vs 2018)
  1. Revenue: 30M vs 28M
  2. Net Income: 3M vs 2.5M
  3. Cash: 5.4M vs 1.5M
ANALYSIS:
  1. NASDAQ move could trigger move upside.
    Most stocks that leave Toronto Stock Exchange and concentrate on US Exchange usually enjoy a good ride with price increase. The listing on NASDAQ of XPEL showed what top price it could achieve when it reached $7.20 on April 3, 2019. Although it came back down on that same day, it managed to pull back up and surpassed that $7.20 high and made a new high again at $8.55 on August 21, 2019. As of this writing August 29, 2019, the current price top at $10.07.
  2. With their positive 10Q report with Revenue, Cash and Net Income combined this company just showed good management.
  3. Visiting also on their website and knowing that they cater cutting-edge technology in the automotive Industry on specialized protection, they just found a niche. This is promising.
INVESTIGATE NEWS 
  1. Yahoo Finance just reported about their record revenue of 2nd quarter reaching $30.1M with improved 35.3% Gross Margin.
  2. Finviz.com showed negative EPS Q/Q and Sales Q/Q of which probably may not reflect just yet with what had been released by XPEL on their latest 10Q report. The average volume shown with Finviz is 43.45K of which may not also reflect yet what the last 6 days of trading occurred with XPEL.
    2019-08-21: 564K
    2019-08-22: 349K
    2019-08-23: 210K
    2019-08-26:   60K
    2019-08-27:   73K
    2019-08-28:  127K
    2019-08-29:  143K
  3. Stocktwits.com seemed to be also late in its following of this stock. It is still listing as $DAP.U.CA, which was the TSXV listing. Nevertheless, the tweets of Vittygant who followed this stock last June and early August had the following entries.

    Vittygant  Aug 10th, 4:53 am
    $DAP.U.CA next earning we’re riding 5.80$-6$ ...u know fundamentals, you should check up on that! This stock is lit in 2018

    Vittygant  Jun 4th, 6:50 pm
    $DAP.U.CA Having such a strong Q1 is very promising for q2 and q3 when car detailing usually is strongest.

    This guy was right with his tweet. He just have to probably get back with $DAP.U.CA as XPEL and take a look at what really happened. Had he invested on this, he would have a lot of gain already.

ANALYSIS on the NEWS and SENTIMENTS. 

It seemed XPEL is not so popular yet, Only a few have noticed with this stock currently. The surge of volume of course is something that you can think of that somebody of course has a hand on it already. And once these other big time investors rally to get in, there will be more upward action and even gap up of price.

B. CALCULATING the Target Price


TP = ((PH - VL) * 3) + BC
TP = Target Price
PH = Previous High
VL = Volatility Low
BC = Breakout Close

From our Chart above we have the following entries:
PH = 8.74 
BC = 8.45
VL = 5

Substituting the values on the formula:
TP = ((8.74 - 5) * 3 ) + 8.45
TP = 19.67

This is the possible price it could probably hit. Before reaching this price there are a lot of Whole number resistance from $9.00, so it is just a good habit to make sure you create a scale out strategy in exiting the trade. If you plan to buy 150 shares, maybe create 3 exit plans of 50 shares each. The first 50 could be when the price reaches 10.50, then another 50 shares when it reaches 12.50 then probably let the other 50 ride wherever the stock may carry it.


C. WEIGHING THE RISK AND REWARD:

Here is the result for the 5% STOP Loss from the $9.00 entry. 
You will enter at $9.00 but if it goes against your plan and dip down at 8.55 you should be ready to get out. Here you will RISK only $0.45 cents/share of loss against $10.67/share Reward. If you will invest on 138 shares you will profit $1,462.46 or you will have a loss of -$72.10 if the trade does not go as planned.

Here is the result for the 7.8% STOP Loss from the $9.00 entry. 
You will enter at $9.00 but if it goes against your plan and dip as low as $8.30 you should be ready to get out. Here you will RISK only $0.70 cents/share of loss against $10.67/share Reward.If you invest on 138 shares you will make a profit of $1,462.46 or you will risk of losing -$106.88 if it goes against your plan.


Here is the result for 3:1 Risk/Reward ratio. T
his is using a stop loss of 35% against your entry price of $9.00. The risk here is a little bit high since you will absorb at least $3.15 loss / share  against your target Profit of $10.67 / share. You will not be whipsawed right away when price would be so volatile but if the trade does not go as planned then you should be prepared to accept the $444.70 loss against the profit of $1,462.46. 


Wednesday, August 28, 2019

Transaction Codes used in Form 4 SEC Filings


The following codes are the common codes used when filing Form 4. If you want learn more on this visit https://en.wikipedia.org/wiki/Category:SEC_filings

General Transaction Codes
P — Open market or private purchase of non-derivative or derivative security
S — Open market or private sale of non-derivative or derivative security
V — Transaction voluntarily reported earlier than required
Rule 16b-3 Transaction Codes
A — Grant, award or other acquisition pursuant to Rule 16b-3(d)
D — Disposition to the issuer of issuer equity securities pursuant to Rule 16b-3(e)
F — Payment of exercise price or tax liability by delivering or with holding securities incident to the receipt, exercise or vesting of a security issued in accordance with
Rule 16b-3
I  — Discretionary transaction in accordance with Rule 16b-3(f) resulting in acquisition or disposition of issuer securities
M — Exercise or conversion of derivative security exempted pursuant to
Rule 16b-3
Derivative Securities Codes (Except for transactions exempted pursuant to Rule 16b-3) 
C — Conversion of derivative security
E — Expiration of short derivative position
H — Expiration (or cancellation) of long derivative position with value received
O — Exercise of out-of-the-money derivative security
X — Exercise of in-the-money or at-the-money derivative security
Other Section 16(b) Exempt Transaction and Small Acquisition Codes (except for Rule 16b-3 codes above)
G — Bona fi de gift
L — Small acquisition under Rule 16a-6
W — Acquisition or disposition by will or the laws of descent and distribution
Z  — Deposit into or withdrawal from voting trust
Other Transaction Codes
J — Other acquisition or disposition (describe transaction)
K — Transaction in equity swap or instrument with similar characteristics
U — Disposition pursuant to a tender of shares in a change of control transaction

More on Different kind of Trading: Vol High - Prior Vol High Stock Entry - Case on CONL (Granite Shares Trust Granite Shares 2x LON)

CHART: CONL (Granite Shares Trust Granite Shares 2x LON) http://charts.stockfetcher.com/sfchart/OeSm5wo7tZ.png https://www.tradingview.com/x...