Monday, June 24, 2019

New 78 Day High and Darvas Box Breakout, espcially with Gap ups and huge volume (ENPH, ARWR, ARQL)

Hello everyone,

Here are the video recordings for the Trading Lessons on New 78 Day High with the Darvas Box Breakout.

2019/06/15 Trading Lesson: New 78 Day High and Darvas Box Breakout
https://youtu.be/oSQMne65bdE

2019/06/21 Trading Lesson: N78 Day High and Nicolas Darvas Theory Part 01

2019/06/21 Trading Lesson:  N78 Day High and Nicolas Darvas Theory Part 02
https://youtu.be/tiKbT0-4i24

I just would like to add 2 important considerations here:
  1. A combination of New 78 Day High with Darvas B15 associated with 400% increase in volume and a gap up is a potent combination of a winning trade. Darvas B15 here refers to the filter we created in stockfetcher.com which identifies Darvas Boxes boundaries and breakouts to subsequent new highs. The B15, means stocks priced below $15.00.
    Examples:
  2. Potent Darvas Box formation follows the following pattern:
    Wide Base, Reduced Boxes, longer pop.
    The stock starts with a Wide Base (Longer consolidation period with deeper price fluctuation). Once it starts to break out from that wide base, next upward Darvas boxes are reduced in sizes, meaning the range is getting smaller. Subsequent breakout from this or these smaller ranges with a huge volume will have a longer pop to follow.
    Example: ARWR
    The Base:
            http://charts.stockfetcher.com/sfchart/Gp1Nqk4kpE.png
    The Reduced Boxes
            http://charts.stockfetcher.com/sfchart/4G6qmpJnXw.png
    The longer Pop
            http://charts.stockfetcher.com/sfchart/pxLoM2fw1J.png
    New Base is formed again
            http://charts.stockfetcher.com/sfchart/aM69ltiwRD.png
            http://charts.stockfetcher.com/sfchart/CR9f7ekpxN.png
    Reduced Box following the Base followed with a Gap-up
            http://charts.stockfetcher.com/sfchart/RV20Ewzukf.png

Enjoy studying guys.

Cheers and have a good one.

Wednesday, June 19, 2019

New 78 Day High with Gap up - ARQL/ENPH

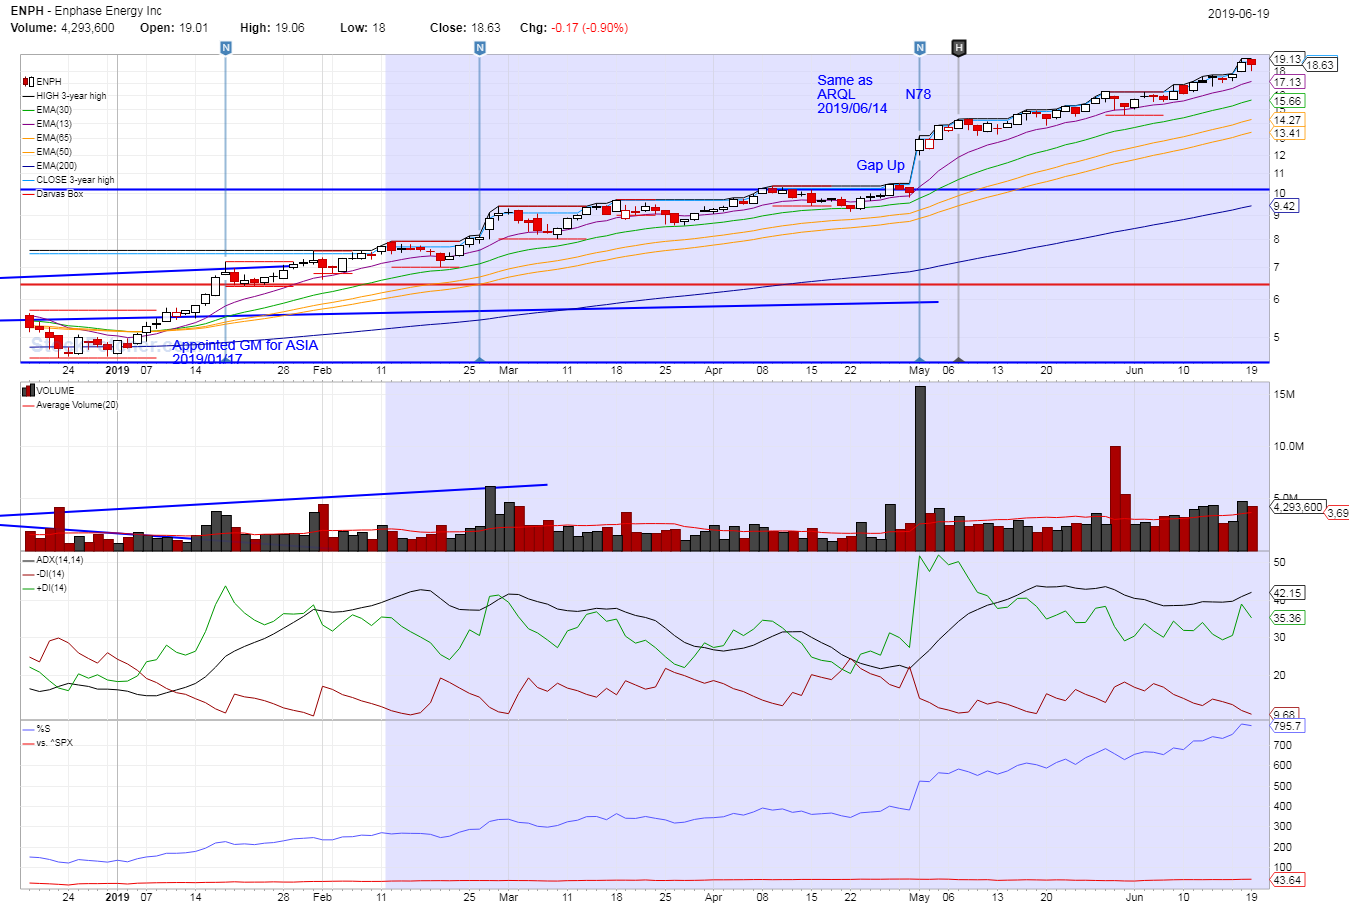
ENPH last May 1, 2019 made a new 78 Day High with a Gap up closing at around $12.80. After 49 days or 34 trading days it had risen above $19.00. Aside from Appearing as New 78 Day High, ENPH at the same time frame made a debut under DARVAS B15 filter of stockfetcher. This is the filter I kept to check for stocks that had made a new high with a huge volume against a previous high contained in a range of highs and lows forming a systematic box where you can determine the fluctuation of a price within a specific level, usually at whole number levels of support and resistance. This box theory was developed by Nicolas Darvas who liked to exploit on the momentum of a stock.

http://charts.stockfetcher.com/sfchart/r41uHENvbz.png


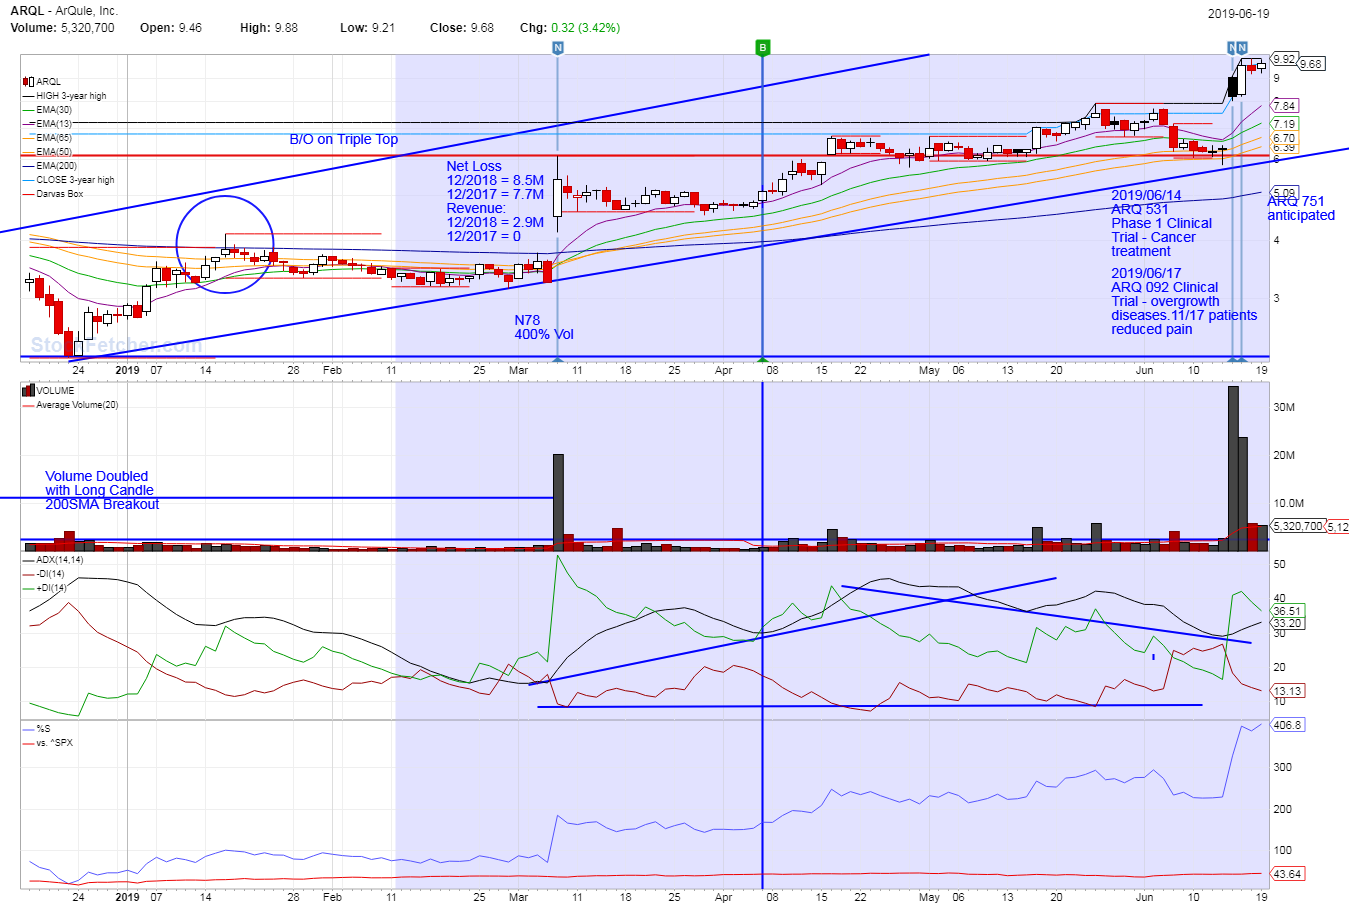
ARQL made a gap up last march 7, 2019 reaching a high of $6.00, consolidating around 4.60 for around 21 days and made another gap up on Jun 14, 2019 and June 17, 2019 reaching a high above $9.00. This seemed to be in a perfect timing for a buy. See ENPH when it made a gap up. It looks like the pattern is repeating on ARQL.
See entry on ARWR when it made a gap-up. Check the blog "New 78 Day High - Gap-up on Big Volume - ARWR Simulation"


The main catalyst of ARQL are the following:

  1. June 22, 2018 it had been added to Russel 2000 Index at the price of around $4.75
  2. Made a Triple Top at 6.50
  3. Broke down 200EMA and went as low as $2.25 Dec. 24, 2018
  4. Broke out of 200EMA and $6.00 resistance with a huge candle and huge volume, doubling its volume from previous volume before it got listed on Rusell 2000 Index.
  5. Revenue increased from 0 to 2.9M from Dec. 2017 to Dec. 2018.
  6. 2 Successful on-going clinical trials on ARQ 531 and ARQ 092 (These are the news when it gained 44% and 21% on 2 succeeding days June 14, 2019 and June 17, 2019.
Here is the Chart of ARQL:
http://charts.stockfetcher.com/sfchart/1oyo3iEtRN.png


Monday, June 10, 2019

TRADING MINOLA ON NEO and EVRI with strong Net Income and Revenue

June 10, 2019 Monday

TRADING MINOLA ON NEO & EVRI + Net Income/Revenue Catalyst

As I was reviewing a particular stock called NEO, I happened to noticed that I had blogged this stock twice.

  1. NEO hitting MINOLA on Stockfetcher published Nov. 7, 2018
  2. NEO hitting MINOLA and hot to position for Entry using the Previous High Volume, published March 1, 2019.

Review on MINOLA:

MINOLA is the term I used for the combination of strategy taken from the best traders.
  1. MIN - stands for MINERVINI, of Mark Minervini who popularized the  SEPA (Specific Entry Point Analysis) and VCP (Volatility Contraction Pattern) strategy entry.
  2. O - stands for O'Neil of William O'Neil who popularized the Pocket Pivot.
  3. LA - stands for Larry of the ADX(14) Larry William strategy.
I combined these 3 elements into 1 single filter of stockfetcher to be able to get me extract of stocks hitting MINOLA point where all the elements from the 3 Masters converged.

The MINOLA Filter on Stockfetcher:

This is how the filter looks like of which I added my own marked with /*Noel J*/. As you can see the filter had evolved over time of which I added more element taken from Mark Shipman, although I did not add his name on the Filter Name I created.


/*BEGINNING OF FILTER*/
/*Minervine SEPA (Specific Entry Point Analysis) combined with O'Neil Pocket Pivot and ADX(14) of Larry Williams*/ 
Show stocks 
/*CURRENT volume is 150% or higher above avg vol(10) 10 day ago*/
CURRENT volume is more than double from previous day volume /*O'Neil*/
where close reached a new 20 days high           /*Larry*/
and Close divided by 260 day low is above 1.25  /*Minervine*/
and Close divided by 260 day high is above 0.75 /*Minervine*/
and CURRENT Volume is more than 200000         /*Noel J*/
and the price is between .5 and 30             /*Noel J*/
and RSI(^SPX,14) > 69                       /*Minervine*/
and draw MA(10)        
and draw MA(20)    
and do not draw ema(18)
and draw MA(50)
and do not draw ema(50)
and draw MA(200)
and MA(200) is increasing for 1 month or more   /*O'Neil*/
and ADX(14) > 20                                /*L.Williams like 30 with Price touching MA(20)*/
and MA(30) is above MA(50)        /*Added Nov.7,2016 Strategy of Mark Shipman
                                                  Big Money Little Effort
                                                  A Winning Strategy for Profitable Long-Term Investment*/
and add column RMI(10,1)
and add column RSI(^SPX,90)
Chart-time 6 months 
/*END OF FILTER*/

The MINOLA Strategy

I will not be explaining the meaning of the filter here, but I will be laying down the Strategy of how to trade once a certain stock reached its first MINOLA point. 

MINOLA Pattern 1 "Huge Pocket on  40 Trading Days + 400% + Vol after 11 Trading Days"

Sample: NEO (MINOLA: Oct. 26, 2018 , 400%+ Vol:  Jan 11, 2019, MINOLA: 2019/03/01)
Catalyst:
       2018/08/06 10Q comparing 2018 vs 2017 2 months before MINOLA:
          Revenue: 67M vs 62M
          Net Income: 5.9M vs -2.1M
        2018/11/05 10Q after MINOLA
          Revenue: 63M vs -3.9M
          Net Income: 2M vs -4.3M
Entry: Close of the 2nd Day after 400% + Volume Spike


MINOLA Pattern 2 "400% + Volume after 15 Trading Days, Vol Breakout on N78 Volume" 

Sample: EVRI (N78: Sep. 13, 2018, MINOLA: Feb 20, 2019, 400%Vol+ : Mar. 13, 2019)
Catalyst:
        2018/08/07 10Q: 2018 vs 2017
           Income: 6M vs -22.5M
           Revenue: 118M vs 242M
        2018/11/06 10Q  2018 vs 2017
           Net Income: 8.1M vs -26.8M
           Revenue: 65M vs 55M
Entry: Close of the 2nd Day after the 400% + Volume Spike


Friday, May 31, 2019

New 78 Day High - Gap-up on Big Volume - ARWR Simulation

New 78 Day High - Gap-up on Big Volume - ARWR Simulation May 9, 2018

This is a simulation of the New 78 Day High which happened last May 9, 2018 with ARWR.
The following are Rules to follow in order to play this New 78 Day High.

  1. Price had broken out of 200EMA (Exponential Moving Average)
  2. Price Retested 200EMA.
  3. Made 2 Previous High Break-out
  4. The New 78 Day High is the Break-out on the 3rd Previous High.
  5. 200EMA is on uptrend
  6. 50EMA becomes the support upward
  7. Volume of New 78 Day High is more than double than any volume of the last 30 days.
In our example ARWR:
  1. Had broken 200EMA on Aug 24, 2017, after 15 days of reporting a Revenue growth of 23,846% from 39K of 2016 to 9.3M in 2018.
  2. Price retested the 200EMA on Dec. 13, 2017 1 day after reporting a Revenue growth of 19,620%.
  3. Made 2 previous break-out before May 9, 2018.
    Jan. 3, 2018 broke $4.50 H1 high.
    Mar. 5, 2018 broke $6.50 H2 high.
  4. The break-out of May 9, 2018 is the break-out from $7.99 H3 high.
  5. The 200EMA from Aug 24, 2017 break-out had been trending upward to May 9, 2018.
  6. The price pullbacks of ARWR had been supported by 50EMA all the way up.
  7. Volume of New 78 Day High is more than double than any volume of the last 30 days.


ARWR TRADINGVIEW 1 YR CHART with Target Price

SETTING THE TARGET PRICE WHEN ENTERING THE TRADE:
We use the following formula to set our Target Price:
TP = (( PH - VL ) * 3 ) + BC
Where:

  • TP = Target Price
  • PH = Previous High
  • VL = VCP Low
  • VCP = Volatility Contraction Pattern (Triangular contraction of Price)
  • BC = Break-out Close
Based from the chart we can substitute the values in our formula:
TP = (( 8.00 - 6.50 ) * 3 ) + 9.00
TP = $13.50

Our Target Price is set to $13.50. As you can see the target is hit. But what we usually do as well other than just setting the target is how to scale out the trade such that going up you place money into your pocket. Also, when the plan does not materialize, what is our Stop Loss so we can exit taking a loss and move to another trade.

SETTING ENTRY TARGET:
Based on the fundamentals of the stock, the previous highs created by ARWR were actually accompanied with very strong revenue jump. 

  1. ARWR had broken 200EMA on Aug 24, 2017, after 15 days of reporting a Revenue growth of 23,846% from 39K of 2016 to 9.3M in 2018.
  2. Its Price retested the 200EMA on Dec. 13, 2017 1 day after reporting a Revenue growth of 19,620%. Then after that retest it jumped 

These 2 fundamentals gave us the confidence other than the technical set-up that give us the New 78 Day High. And to set our entry, we just need to follow the 1st red day from the moment of break-out. On the 4th day, May 14, 2018 after the break-out we had a red candle. This is the first pull-back. What usually happens, this red candle becomes the price point for entry. You can take the mid-body of that candle as your entry. Buy shares on this price level within probably 4 weeks time. And just wait for it to get hit. Sometimes, the hit happens right away and you are in. In this case the mid-body is $9.69 or $9.70. 

SCALING OUT YOUR TRADE:
Once you are in the trade, make sure to scale out. Plan to take some money off from the table. If our Target is $13.50. You can scale out at 10.00, 11.00, 12.00 or 13.00. These are whole number resistance and support. If you have a small amount of shares purchased, just let it ride. If you bought a lot of shares, make sure to take money from the table.

STOP LOSS
Never work on the trade without a planned stop loss. It's nice to have a hard stop loss, but the downside of this is that Market Maker sees all these stop loss orders and will always try to take them out. Thus, the better strategy is to set it mentally. And if the plan does not materialize exit based on your mental stop loss. In this case our Stop Loss with our entry at 9.70 would be 9.45 or if you can stretch it to 8.00 which was the whole number break-out. Try to limit your losses within 5-7% out of your total trade. That's why it is important to enter on pullbacks because you are sure that you entered at a quite lower price level that entering when it is skyrocketing.

ACCOMPANYING VIDEO LESSON USING Accelotrade for simulation on ARWR.


ARWR TRADINGVIEW 1 YR CHART hitting Target Price

ARWR TRADINGVIEW 1 YR CHART from Target Price to huge drop

 ARWR TRADINGVIEW 1 YR CHART with pulling back to 200EMA

ARWR FROM STOCKFETCHER.COM 1 YR CHART - Revival Pattern

ARWR FROM STOCKFETCHER.COM 1YR CHART - New 78 Day High


    Thursday, May 23, 2019

    Double Day New 78 Day High - INS

    May 23, 2019
    I was trying to offset my New 78 Day High filter on Stockfetcher back tracking 261 days ago, and I found a gem called INS. This stock may have gone from the radar of most traders because it was trading on less than 50K shares. The highest peak it had was Jan. 6, 2017. Then after 1 year and 4 months it made a New 78 Day High with a volume of only a meager  21.5K on May 9, 2018 . But what was surprising is it made again another High the next day with a volume 469% higher than the previous high. For 10.9 years the price had always been $5.00. The New day 78 Day high with just 21.5K trading volume had made a high of 6.24 breaking out $5.00 and $6.00. Then the following day with the volume of 100.9K shares made a new high of 7.64. It did pull back at 6.50 after 5 days but after that it never looked back reaching a high of $48.89 for exactly 365 days (1 year), that's 783% increase. Currently it is standing at 543.26%.


    Stock Market Index Symbols used in Stockfetcher

    Sometimes it is good to pull up the chart of an index so you can compare your stock against the over-all run of the market. Stocks that shows strong divergence when index is going down and it is holding up its price higher, then such stock is a candidate for buying. The opposite would the shorting case also. Larry Williams is the one who popularize this method. But before doing that digernce comparison it would be good to know what the symbols of those indices.

    Stockfetcher.com has the following entry which can be found on this help link, https://help.stockfetcher.com/sfhelp/?id=100229

    ^VIXCBOE Volatility Index
    ^ADRINT L MKT INDX
    ^ADRAAMEX ADVANCE/DECLINE RATIO
    ^ADRDOTC ADVANCE/DECLINE RATIO^i
    ^ADRNNYSE ADVANCE/DECLINE RATIO
    ^ADRQNASD ADVANCE/DECLINE RATIO
    ^ADVAAMEX ADVANCING SHARES
    ^ADVDOTC ADVANCING SHARES
    ^ADVNNYSE ADVANCING SHARES
    ^ADVQNASD ADVANCING SHARES
    ^AMZALERIAN MLP INDEX
    ^BCMMBARCHART MARKET MOMENTUM
    ^BKXKBW BANK INDEX
    ^RUARussell 3000 Index
    ^BTKBIOTECH INDEX
    ^VXDCBOE DJIA VOLATILITY INDEX
    ^BWHPOWERSHARES WILDERHILL CLEAN EN
    ^BXDCBOE DJIA BUYWRITE INDEX
    ^BXMCBOE BUYWRITE MONTHLY INDEX
    ^BXNCBOE BUYWRITE MONTHLY INDEX
    ^BXRCBOE RUSSELL 2000 BUYWRITE INDE
    ^SPXS & P 500
    ^BXYCBOE S& P 500 BUYWRITE INDEX
    ^CEXS& P CHEMICALS INDEX
    ^IXICNASDAQ Composite
    ^CKGS&P 600 BARRA GRWTH
    ^OEXS & P 100
    ^COMPDOW JONES COMP
    ^CVKSMCP 600BARR VAL
    ^CYMCLAYMORE YIELD ETF IOPV
    ^CZHAMEX CHINA INDX
    ^DDADJIA VOLATILITY INDEX - OFFER S
    ^DDBDJIA VOLATILITY INDEX - BID SID
    ^DDXDISK DRIVE NDX
    ^DECAAMEX DECLINING SHARES
    ^DECDOTC DECLINING SHARES
    ^DECNNYSE DECLINING SHARES
    ^DECQNASD DECLINING SHARES
    ^DFIRABO FIN. INDEX
    ^DGEEW PHARMACEUTICL
    ^DHCDYNAMIC HLTHCARE INTELL
    ^DHDDYNAMIC BANKING INTELL
    ^DJECDOW JONES INTERNET COMMERCE IND
    ^DMTDLY MIRROW IDX
    ^DOWCDOW JONES COMP
    ^DOWIDOW JONES INDU
    ^DOWTDOW JONES TRAN
    ^DOWUDOW JONES UTIL
    ^DOWVTREASURIES IDX
    ^DRCIDJ COMPREIT
    ^DREIDJ EQUITYREIT
    ^DRGPHARMCEUTICL NDX
    ^DSAEDJ US AERODEF
    ^DSAFDJ US DELIVRYSRV
    ^DSAGDJ US ASSETMNG
    ^DSAIDJ US ELECEQUIP
    ^DSALDJ US ALUMINUM
    ^DSAMDJ US MEDEQUIP
    ^DSAPDJ US AUTOPARTS
    ^DSARDJ US AIRLINES
    ^DSASDJ US AEROSPACE
    ^DSATDJ US AUTOPARTS
    ^DSAUDJ US AUTOMOBILE
    ^DSAVDJ US MEDIAAGN
    ^DSBCDJ US BRDCASTENT
    ^DSBDDJ US BLDGMATFIX
    ^DSBEDJ US BSTRNGEMP
    ^DSBKDJ US BANKS
    ^DSBMDJ US BASICMAT
    ^DSBSDJ US BSCRSRCES
    ^DSBTDJ US BIOTECHNO
    ^DSBVDJ US BEVERAGES
    ^DSCADJ US GAMBLING
    ^DSCCDJ US COMMCHEM
    ^DSCEDJ US CONSELECT
    ^DSCFDJ US CLOTHACCSS
    ^DSCGDJ US TRAVLEIS
    ^DSCHDJ US CHEMICALS
    ^DSCLDJ US COAL
    ^DSCMDJ US PERSPROD
    ^DSCNDJ US CONSMATRLS
    ^DSCPDJ US CTNRS&PKNG
    ^DSCRDJ US CMPTRHRDWR
    ^DSCSDJ US SPLTYCNSRV
    ^DSCTDJ US SEMICONDTR
    ^DSCXDJ US SPCLTYCHEM
    ^DSCYDJ US CONSUMSRV
    ^DSDBDJ US BREWERS
    ^DSDNDJ US DEFENSE
    ^DSDRDJ US FDDRGRET
    ^DSDSDJ US INSUPPLIER
    ^DSDVDJ US CMPTRSRV
    ^DSECDJ US ELCCOMPEQP
    ^DSEEDJ US ELECEQUP
    ^DSENDJ US OIL&GAS
    ^DSEUDJ US ELECTRCTY
    ^DSFADJ US FINADMIN
    ^DSFBDJ US FOOD&BEV
    ^DSFCDJ US FXLNTELCM
    ^DSFDDJ US FOODRTWHSL
    ^DSFEDJ US INDUSTMACH
    ^DSFHDJ US FURNISHNG
    ^DSFIDJ US FINCLSRV
    ^DSFNDJ US FINANCIALS
    ^DSFODJ US FOODPRODRS
    ^DSFPDJ US FOODPRDCTS
    ^DSFRDJ US FORESTPAPR
    ^DSFTDJ US FOOTWEAR
    ^DSGFDJ US GENFINAN
    ^DSGIDJ US GENINDUST
    ^DSGTDJ US GENRETAIL
    ^DSGUDJ US GASDISTRIB
    ^DSHBDJ US HOMECONS
    ^DSHCDJ US HLTHCARE
    ^DSHDDJ US DURHLDPROD
    ^DSHGDJ US HLDGOODS
    ^DSHIDJ US HMIMPRETL
    ^DSHNDJ US NDURHLDPRD
    ^DSHPDJ US HLTHCRPVDR
    ^DSHRDJ US COMRVEHTRK
    ^DSHVDJ US HVYCONS
    ^DSIBDJ US INSBROKERS
    ^DSIDDJ US DVSFINDUS
    ^DSIFDJ US FLLINEINS
    ^DSIGDJ US INDGDS&SRV
    ^DSILDJ US LIFEINSUR
    ^DSIMDJ US INDMETALS
    ^DSINDJ US INDSTRIALS
    ^DSIPDJ US PROPCASINS
    ^DSIQDJ US INDSTENGNG
    ^DSIRDJ US INSURANCE
    ^DSISDJ US SUPPORTSRV
    ^DSITDJ US INDSTTRANS
    ^DSIUDJ US REINSURAN
    ^DSIVDJ US BUSSUPSRV
    ^DSIXDJ US NLIFEINSUR
    ^DSLEDJ US LEISGOODS
    ^DSLGDJ US HOTELS
    ^DSLWDJ US LOWCAP
    ^DSMCDJ US HCREQPSRV
    ^DSMEDJ US MEDIA
    ^DSMFDJ US MORTGFIN
    ^DSMGDJ US MINING
    ^DSMSDJ US MDSUPPLIES
    ^DSMTDJ US MARTRANSPT
    ^DSMUDJ US MULUTILTES
    ^DSNCDJ US CONSUMGDS
    ^DSNFDJ US NONFERMET
    ^DSNGDJ US PERHLDGDS
    ^DSNSDJ US INTERNET
    ^DSOEDJ US ELECOFFEQP
    ^DSOGDJ US OILGAS
    ^DSOIDJ US OILEQPSRV
    ^DSOLDJ US INTGOILGAS
    ^DSOQDJ US OILEQPSRV
    ^DSOSDJ US EXPLPROD
    ^DSPBDJ US PUBLISHING
    ^DSPCDJ US WSTDSPSRV
    ^DSPGDJ US PERSGOODS
    ^DSPLDJ US PIPELINES
    ^DSPMDJ US GOLDMNG
    ^DSPNDJ US PHARMBIO
    ^DSPPDJ US PAPER
    ^DSPRDJ US PHARMCTCLS
    ^DSPTDJ US PLTPRECMET
    ^DSRADJ US APPRLRET
    ^DSRBDJ US BRDLNRET
    ^DSRDDJ US DRUGRET
    ^DSRHDJ US RESTHLDG
    ^DSRIDJ US RESTINVTR
    ^DSRPDJ US RECPRODUCT
    ^DSRQDJ US RECSERVICE
    ^DSRRDJ US RAILROADS
    ^DSRSDJ US SPLTYRET
    ^DSRTDJ US RETAIL
    ^DSRUDJ US RESTRBARS
    ^DSSBDJ US INVSRV
    ^DSSCDJ US SEMCNDCTRS
    ^DSSDDJ US SOFTDRINKS
    ^DSSFDJ US CONSUMFIN
    ^DSSPDJ US SPECIALFIN
    ^DSSTDJ US STEEL
    ^DSSVDJ US SFTCPTRSRV
    ^DSSWDJ US SOFTWARE
    ^DSTBDJ US TOBACCO
    ^DSTCDJ US TECHNOLOGY
    ^DSTKDJ US TRUCKING
    ^DSTLDJ US TELECOM
    ^DSTPDJ US TOPCAP
    ^DSTQDJ US TECHHRDEQ
    ^DSTRDJ US TIRES
    ^DSTSDJ US TRANSSRV
    ^DSTTDJ US TRVLTOUR
    ^DSTYDJ US TOYS
    ^DSUODJ US GASWTRMUT
    ^DSUTDJ US UTILITIES
    ^DSVNDJ US DISVINTNER
    ^DSWCDJ US MOBTELECOM
    ^DSWUDJ US WATER
    ^DTCIDJ COMPREIT TR
    ^DTEIDJ EQUITYREIT TR
    ^DTWCDJ COMPAVGTR
    ^DTWIDJ INDUS AVG TR
    ^DTWTDJ TRANSAVGTR
    ^DTWUDJ UTILITYAVGTR
    ^DUSLDJ US LRGCAP
    ^DUSMDJ US MIDCAP
    ^DUSSDJ US SMLCAP
    ^DWEDYNAMIC ENERGY EXPLORATION & PR
    ^DWJDYNAMIC INSURANCE INTELLIDEX
    ^DWODYNAMIC OIL SERVICES INTELLIDEX
    ^DWRDYNAMIC RETAIL INTELLIDEX
    ^DWUDYNAMIC UTILITIES INTELLIDEX
    ^DWYDYNAMIC TELECOMMUNICATION & WIR
    ^DXSSPADE DEFENSE
    ^DXYDOLLAR INDEX
    ^DYHDYNAMIC TOP 200 INTELL
    ^DYI$MKT INTELLIDEX
    ^DYOOTC INTELLIDEX
    ^DZCDYNAMIC SOFTWARE INTELLIDEX
    ^DZEDYNAMIC SEMICONDUCTOR INTELLIDE
    ^DZFDYNAMIC FOOD & BEVERAGE INTELLI
    ^DZHDYNAMIC HARDWARE & CONS ELEC IN
    ^DZLDYNAMIC LEISURE&ENTERTAINMENT I
    ^DZMDYNAMIC MEDIA INTELLIDEX
    ^DZNDYNAMIC NETWORKING INTELLIDEX
    ^DZODYNAMIC BIOTECH & GENOME INTELL
    ^DZRDYNAMIC PHARMACEUTICAL INTELLID
    ^ECOWH CLEAN ENERGY
    ^EEDCLAYMORE BRIC ETF IOPV
    ^EMXMER LYN EURO NDX
    ^EPXSIG OIL EXPLORATION & PRODUCERS
    ^ESXSEL EURO 50 NDX
    ^EUXMAJR 11 INTL NDX
    ^EVZCBOE EURO CURR VOL IND
    ^EZBDYNAMIC BS MT INTELLIDEX
    ^EZFDYNAMIC FINCL INTELLIDEX
    ^EZKDYNAMIC ENRGY INTELLIDEX
    ^EZLDYNAMIC INDUS INTELLIDEX
    ^EZSDYNAMIC CN ST INTELLIDEX
    ^EZVDYNAMIC TECHN INTELLIDEX
    ^EZXDYNAMIC HLTHC INTELLIDEX
    ^EZZDYNAMIC CN DS INTELLIDEX
    ^FBVPOWERSHRS DB G10 FD IOPV
    ^FVX5-YEAR TREASURY NOTE
    ^GDMAMEX GOLD MINERS
    ^GLIMER LYN GBL MKT
    ^GMIMKT VECTOR GOLD MIN IOPV
    ^GNXGSCI TOTAL RETURNS
    ^GVZGSTI SERVICES INDEX SETTLEMENT
    ^GWIM LYNCH SPDR
    ^HGXHOUSING INDEX
    ^HIGAAMEX NEW HIGHS
    ^HIGDOTC NEW HIGHS
    ^HIGNNYSE NEW HIGHS
    ^HIGQNASD NEW HIGHS
    ^HKOH.K. OPT [FLTNG]
    ^HKXH.K. 30 WARRANTS
    ^HUIGOLD BUGS NDX
    ^HVXMKT VECTOR ENV SERV IOPV
    ^HWICOMP HARDWR
    ^ICKISE CHINDIA INDEX
    ^IDXS&P MIDCAP 400
    ^IEBDYNAMIC LARGE CAP INTELL
    ^IEKDYNAMIC MID CAP INTELL
    ^IEYDYNAMIC SMALL CAP INTELL
    ^IIBSEMI INDS PLUS
    ^ILHDYN LGCP GRO
    ^ILJDYN MDCP GRO
    ^ILKDYN SMCP GRO
    ^ILPDYN MDCP VAL
    ^ILRDYNAMIC AGR GRWTH INTLDX
    ^ILUDYNAMIC DEEP VAL INTELDX
    ^ILWDYN LGCP VAL
    ^ILZDYN SMCP VAL
    ^INDUDOW JONES INDU
    ^INXS&P 500 INDEX
    ^IQXS&P 500 EQUAL WEIGHT
    ^IQYS&P SMALLCAP 600
    ^IQZS&P 1000
    ^IRX13-WEEK TREASURY BILL
    ^IUXRUSSELL 2000
    ^IUXXNASDAQ 100
    ^IXBINDEX IXB
    ^IXEENERGY SELECT
    ^IXFNDAQ FINANCIAL 100
    ^IXINMS INDUSTRIAL
    ^IXMFINL SELECT
    ^IXRCONSUMER STAPLE
    ^IXTTECHNOLOGY SEL
    ^IXUUTILITIES SEL
    ^IXVHLTH CARE SEL
    ^IXYCONSM.SELECT
    ^JKCML LONG/SHRT III
    ^JPNJAPAN INDEX
    ^KIXKBW INSURANCE INDEX
    ^KLXMKT VECTORS STEEL IOPV
    ^KRXKBW REGIONAL BANKING INDEX
    ^KSXKBW CAP MRKTS
    ^LOWAAMEX NEW LOWS
    ^LOWDOTC NEW LOWS
    ^LOWNNYSE NEW LOWS
    ^LOWQNASD NEW LOWS
    ^MBOCHINESE MPS BSKT
    ^MDOMID OPN/CLS AVGE
    ^MFXKBW MORTGAGE FINANCE INDEX
    ^MGDMIDCP 400BARRA
    ^MIAMID O/C/H/L AVG
    ^MIDMIDCAP 400 IDX
    ^MIHMID HI/LO AVGE
    ^MIVMID-CAP SETTLE
    ^MLOMER LYN TECH 100
    ^MMXMAJOR MARKET INDEX
    ^MNGAMEX MINI-NATURAL GAS INDEX
    ^MSHM STAN HI TECH
    ^MUVMDCP 400BAR VAL
    ^MXYMEXICO INDEX
    ^NASXNASDAQ COMPOSITE
    ^NBINASDAQ BIOTECHNOLOGY [DRM]
    ^NFACTS FEED FA
    ^NQGMNDAQ GLOBAL MARKET COMPOSITE
    ^NSHDNYSE SHARES DECLINES
    ^NSHRNYSE ADVANCE DECLINES RATIO
    ^NSHUNYSE ADVANCES DECLINES
    ^NVLDNYSE VOLUME DECLINES
    ^NVLUNYSE VOLUME ADVANCES
    ^NWXNETWORK INDEX
    ^NYANYSE COMPOSITE
    ^OOIS&P GL 100 ID
    ^OSXOIL SERVICE
    ^OVXCBOE CRUDE OIL VOLATILITY INDEX
    ^PHNAMEX TELECOM
    ^RAGRUSSELL 3000 GRO
    ^RAVRUSSELL 3000 VAL
    ^RDGRUSSELL MDCP GRO
    ^RLGRUSSELL 1000 GROWTH INDEX
    ^RLVRUSSELL 1000 VALUE INDEX
    ^RMCRUSSELL MIDCAP
    ^RMVRUSSELL MDCP VAL
    ^RMZTHE MSCI REIT INDEX
    ^RPEELEC PWR NATG
    ^RTFRUSSELL TOP 50 INDEX
    ^RUFISE HOMEBUILDERS INDEX
    ^RUIRUSSELL 1000
    ^RUJRUSSELL 2000 VAL
    ^RUORUSSELL 2000 GRO
    ^RVXCBOE RUSSELL 2000 VOLATILITY IN
    ^SINISE SINDEX INDEX
    ^SISSEMICOND IDX
    ^SOXSEMICONDUCTOR INDEX
    ^SUNIMAC GLOBAL SOLAR INDEX
    ^SVOPHLX SIG ENERGY MLP INDX
    ^TICKNYSE TICK
    ^TICXNYSE TICK
    ^TIKIDOW TICK
    ^TIKXDOW TICK
    ^TNX10-YEAR TREASURY NOTE
    ^TOBTOBACCO INDEX
    ^TRANDOW JONES TRAN
    ^TRINNYSE TRIN
    ^TYX30-YEAR TREASURY BOND
    ^UNCAAMEX UNCHANGED SHARES
    ^UNCDOTC UNCHANGED SHARES
    ^UNCNNYSE UNCHANGED SHARES
    ^UNCQNASD UNCHANGED SHARES
    ^UOIUS OIL IOPV
    ^UTILDOW JONES UTIL
    ^UTYUTILITY INDEX
    ^VIOCBOE OIL INDEX REDUCED LEAP 199
    ^VLAVALUE LINE INDEX
    ^VLGVALUE LINE GEOMETRIC
    ^VWACBOE MARKET VOLATILITY -SPX ASK
    ^VWBCBOE MARKET VOLATILITY -SPX BID
    ^VXBJUMBO CBOE VOLATILITY INDEX
    ^VXNCBOE NASDAQ VOLATILITY INDEX
    ^VXOCBOE OEX VOLATILITY INDEX
    ^VXVCBOE S&P 500 3M VOLATILITY INDEX
    ^WMXISE WALMART SUPLR INDEX
    ^XALAIRLINE INDEX
    ^XAUGOLD/SILVER INDX
    ^XAXAMEX COMPOSITE
    ^XBDSEC BROKER DEALR
    ^XCICOMPUTER TECH
    ^XEOS& P 100 INDEX[EUROPEAN STYLE
    ^XFIFINANCIAL NDX
    ^XHLHEALTHCARE NDX
    ^XIDINDUSTRIAL NDX
    ^XIIINSTITUTIONL NDX
    ^XITINFO TECH NDX
    ^XMIMAJOR MARKET NDX
    ^XNANAT RESOURCE NDX
    ^XNGNATURAL GAS
    ^XOIOIL INDEX
    ^XSPS& P 500 MINI-SPX OPTIO NS IND
    ^XTCN.A. TELECOM NDX
    ^ZAXZACKS MICRO CAP INDEX
    ^ZOCCBOE TECHNOLOGY INDEX REDUCED L


    More on Different kind of Trading: Vol High - Prior Vol High Stock Entry - Case on CONL (Granite Shares Trust Granite Shares 2x LON)

    CHART: CONL (Granite Shares Trust Granite Shares 2x LON) http://charts.stockfetcher.com/sfchart/OeSm5wo7tZ.png https://www.tradingview.com/x...