PSTI

| Market Cap | 159.57M | EPS (ttm) | -0.31 |
| P/E | - | EPS this Y | -8.90% |
| Forward P/E | - | EPS next Y | -6.10% |
| PEG | - | EPS past 5Y | 1.10% |
| P/S | 3191.47 | EPS next 5Y | - |
| P/B | 4.09 | EPS Q/Q | 4.00% |
| Dividend | - | Sales Q/Q | - |
| Insider Own | 2.30% | Inst Own | 4.20% |
| Insider Trans | -2.64% | Inst Trans | -1.58% |
| Short Float | 1.76% | Earnings | Feb 28 |
| Analyst Recom | 2.00 | Target Price | 3.83 |
| Avg Volume | 281.78K | 52W Range | 1.06 - 2.12 |
HSGX
| Market Cap | 71.92M | EPS (ttm) | -1.00 |
| P/E | - | EPS this Y | -2.10% |
| Forward P/E | - | EPS next Y | 10.00% |
| PEG | - | EPS past 5Y | 22.70% |
| P/S | - | EPS next 5Y | - |
| P/B | - | EPS Q/Q | -118.10% |
| Dividend | - | Sales Q/Q | - |
| Insider Own | 13.86% | Inst Own | 60.60% |
| Insider Trans | 0.00% | Inst Trans | 11.62% |
| Short Float | 0.16% | Earnings | Mar 15/b |
| Analyst Recom | 1.60 | Target Price | 5.50 |
| Avg Volume | 155.35K | 52W Range | 1.55 - 3.35 |
UTSI (120 days)
October 6, 2017

| Market Cap | 186.84M | EPS (ttm) | 0.20 |
| P/E | 27.01 | EPS this Y | 327.30% |
| Forward P/E | - | EPS next Y | - |
| PEG | 1.23 | EPS past 5Y | -22.82% |
| P/S | 1.91 | EPS next 5Y | 22.00% |
| P/B | 2.08 | EPS Q/Q | - |
| Dividend | - | Sales Q/Q | 11.00% |
| Insider Own | 51.46% | Inst Own | 35.30% |
| Insider Trans | 0.00% | Inst Trans | -0.16% |
| Short Float | 0.30% | Earnings | Mar 16/b |
| Analyst Recom | 2.00 | Target Price | 5.00 |
| Avg Volume | 120.77K | 52W Range | 1.80 - 6.51 |
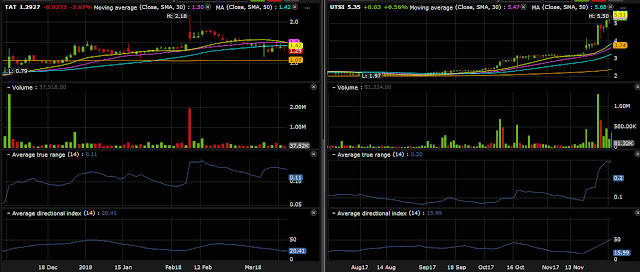
Feb 7, 2018 of TAT might take the same run as with UTSI Mar. 31, 2017
It seemed like UTSI, TAT is looking at 200SMA support(orange line). As soon as UTSI touched the 200SMA, it propelled upward to hit the previous high of the wick on the long red shooting star or inverted hammer at $2.40. From there it retested the 200SMA and went as low as $1.97 just 6cents shy from the previous low of $1.91. From this support it rallied back up breaking out the previous 2 highs of the red candle and the secondary top formed. After the breakout with a heavy volume it went as high as $6.00. Hopefully this is the pattern I am looking for TAT.

| Market Cap | 67.49M | EPS (ttm) | -0.54 |
| P/E | - | EPS this Y | 21.70% |
| Forward P/E | - | EPS next Y | - |
| PEG | - | EPS past 5Y | 25.20% |
| P/S | 1.12 | EPS next 5Y | - |
| P/B | 1.53 | EPS Q/Q | 7.80% |
| Dividend | - | Sales Q/Q | -24.00% |
| Insider Own | 1.60% | Inst Own | 24.00% |
| Insider Trans | -7.66% | Inst Trans | 2.90% |
| Short Float | 0.27% | Earnings | Mar 28/a |
| Analyst Recom | 3.00 | Target Price | 1.89 |
| Avg Volume | 181.45K | 52W Range | 0.58 - 2.18 |


No comments:
Post a Comment