Wednesday, April 10, 2024

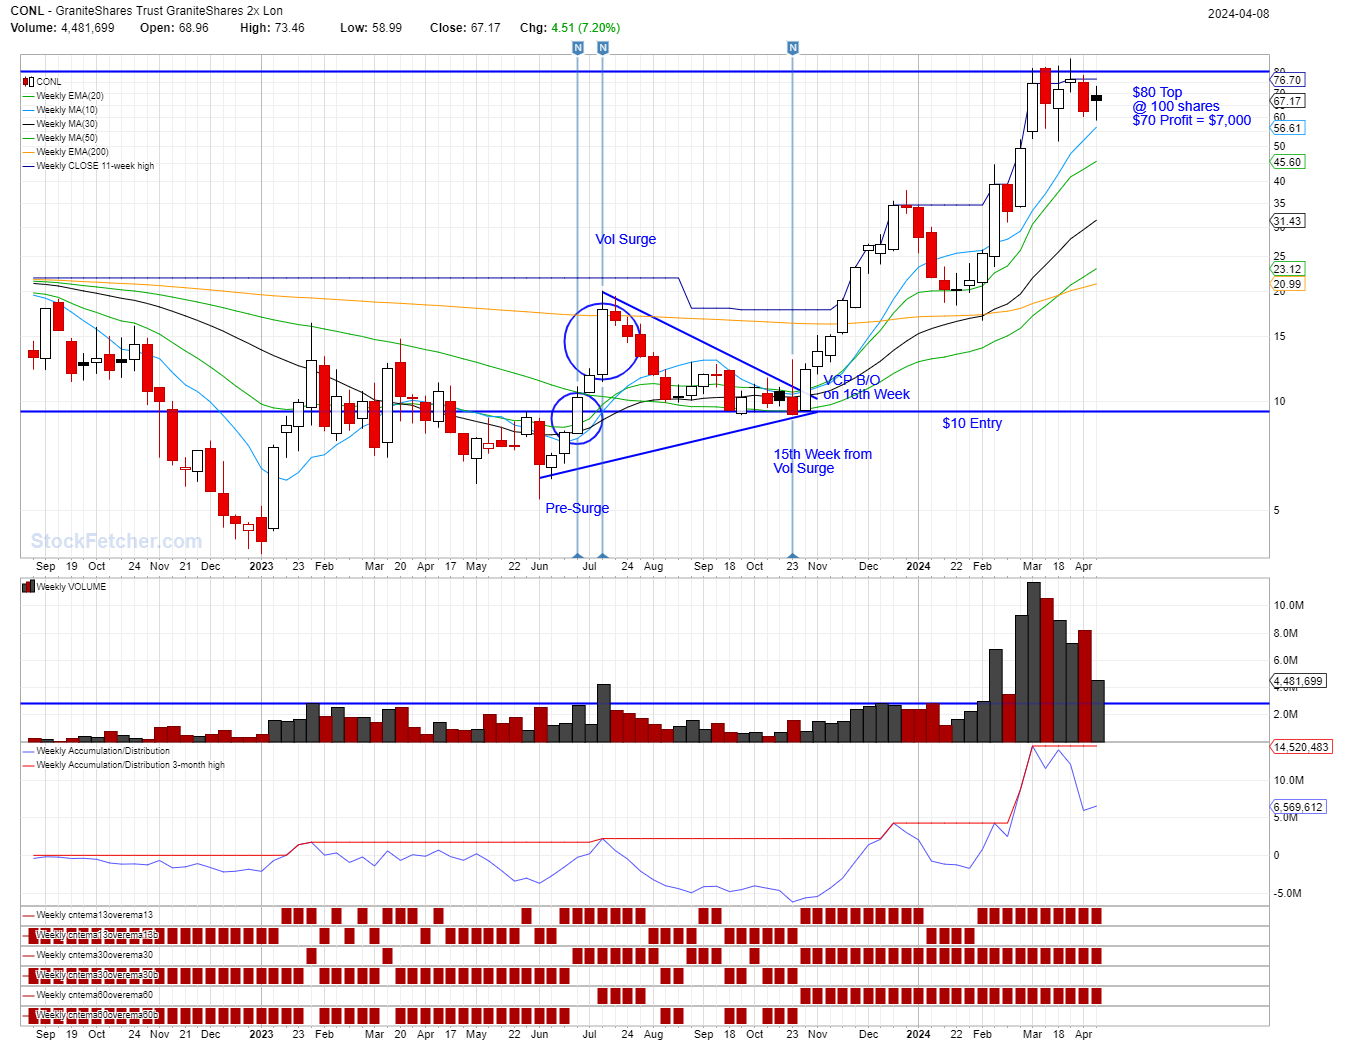
More on Different kind of Trading: Vol High - Prior Vol High Stock Entry - Case on CONL (Granite Shares Trust Granite Shares 2x LON)

CHART: CONL (Granite Shares Trust Granite Shares 2x LON)

http://charts.stockfetcher.com/sfchart/OeSm5wo7tZ.png

https://www.tradingview.com/x/m16IVb2p/

Rule:

1. Filter Weekly MINOLA on Stockfetcher

2. Back Track 3 month and 2 weeks

3. Find a Chart with 3.5 months VCP Break Out

4. Buy Shares on the Pre-Surge Week

        if candle is Bearish buy the Open

        if candle is Bullish buy the Close (In case of Vol Surge 2, you can buy the Open of Pre-Surge 2)

    Or Buy Shares on Preceding Candle of VCP B/O

        if candle is Bearish buy the Open (In this case we buy $10.23, the Open of 15th Week Candle)

        if candle is Bullish buy the Close

5. Sell after 4.5 months 

6. Profit in this case:

PROFIT: $82.20-$10.23 = $71.97

      $71.97 * 100 shares = $7,197


Wednesday, April 21, 2021

SKLZ Potential come back from bearish slide - Big Pay Day for those traders who understand the huge Net Loss and the selling of Class A Shares.

SKLZ Analysis just based on Candle and Volume

Skillz, one of the leading management and prizing platform for online mobile games had enjoyed a wonderful bullish run after it made a huge gap-up accompanied with a huge volume of around 45M shares last Sep 2, 2020 until Feb 5, 2021. Sep 15, 2021 was the day when the 5 months offering of their Series E stocks had been closed. Those that had gotten early for the price target of $32.208 on that offering had made a very good killing, much more when it made a secondary gap-up from $32.00 to $43.00. Such a parabolic move can always result on a sudden pullback too. The rise to $43.00 had a pullback to $32.208 which was supposed to be the retest of that price target on the initial public offering of their series E stocks. It would have been a good pullback but it was drawn lower because on March 12, 2021 they released their 10K Security Filing bearing a 92% Revenue increase from 120M to 230M but on the other hand taking a considerable increase of Net loss from 24M to 122M.

Market Maker can always utilize this Net Loss as a catalyst to bring the stock down. Thus, on the 18th of March 2021, when they again made another public offering of their Class A stocks, the whole price move went dwindling down. This platform really looks promising, but big time investors are not willing to buy at the highly valued level. Much of the price support of this stock comes down to around $12.50 where you have 2 huge volume breakouts (July 16, 2020 and Sep. 2, 2020 where volumes had risen 7M and 45M shares. This is the price line that most of the Investors from the Series E stocks started accumulating. The same big time buyers are probably wanting to add more of their shares at the same price level where they had started accumulating. Market Maker sees all these and seizes the opportunity to shake up the apple tree so the retail investors would relinquish their shares and the Market Maker will have ample shares to give to these hungry buyers at this price level.

With the current (2020/04/21) candle formation of a bullish engulfing pattern accompanied with a huge volume of 76M engulfing also the 65M red volume of last March 19, 2021 bearish trade, it looked like there is a signal of a reversal from the price waterfall.


2024/11/30 Saturday:

Evaluation of SKLZ based on Mark Minervini's Rule in his Trade Like a Stock market Wizzard.


As I looked at this chart after a longer time horizon, I realized that even though the stock showed a promising candle stick in a bullish engulfing pattern accompanied with heavy volume, the move could be a trap move since the price is literally below the 200Days Moving Average with all the other moving averages crossing below the 200SMA. This is an omen that needs to be watched out. Revenue is not really a good point of measure for stock's performance. Traders seemed to value more the significant or drastic move of a Net Loss. That March 18, 2021 when they offered their Class A stocks and the price went dwindling that was a day to question why are they offering their Class A stocks. Would that mean that they are on the verge of financial shipwreck and they need cash using their Class A stocks to save its complete downfall? Those traders who see this development saw already the big pay day on shorting the stock. 

If you use the rule of Mark Minervini found on Page 197 of his book Trade Like a Stock market Wizard, this condition of SKLZ is not a buy point. It fails in Super Performance Stock Profile.

Insist that a stock be in a stage 2 uptrend before you consider buying. The proper time to begin buying is as the price emerges from a proper consolidation.


Accelotrade is no longer active and no longer playable. Don't look for the game. Just enjoy the comments. 

If you want to test your ability accelotrading against an AI on this particular stock. Please visit and sign-up with accelotrade.com. 
In PLAY Mode, Create a game called SKLZ_yourname, set the following information:
Game Type: Custom
Ticker Symbol: SKLZ 
Time Out: 3min
Duration: 50 days
Simulation Date: Dec. 17, 2020
The rest of the other information keep them as they are. 

Click on the Players tab and under Invited Players click on AI. Check all boxes if you want. Click Create after this setting.

You can also invite your friends and families to play along with you in this game.
This game might just help you understand more how to trade and react on Bullish engulfing candle situation.


Thursday, March 25, 2021

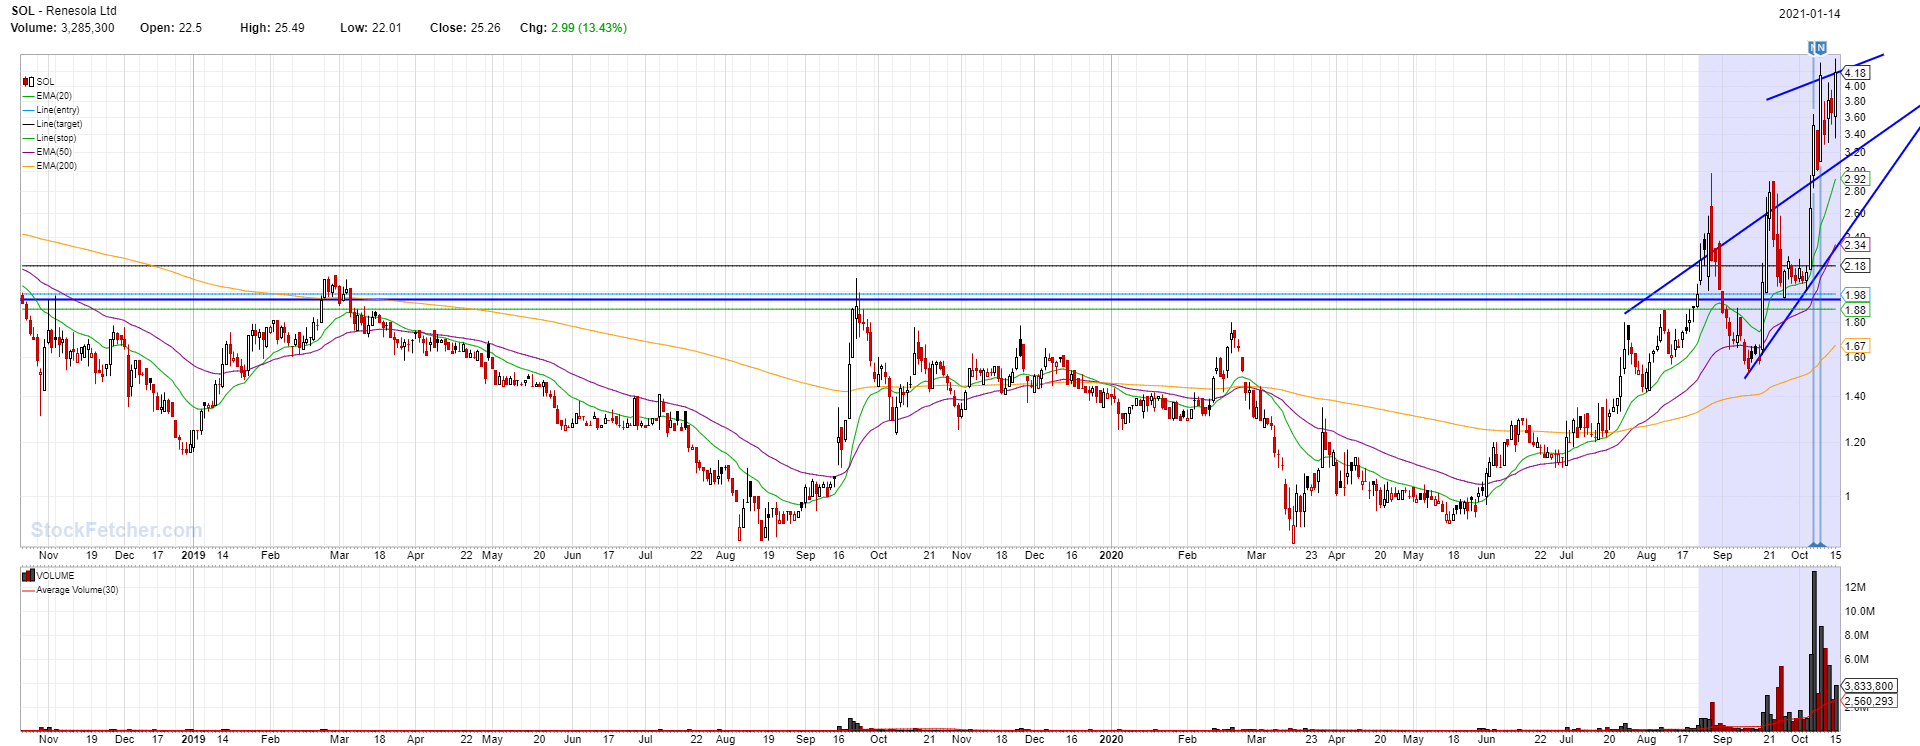
N78 Day High SOL

 SOL - Renesola Ltd

How this $2.00 stock made a huge jump in few short months.


Oct 7 and Oct 9, 2020 it made Double N78 Day High with huge volume.


Tuesday, February 9, 2021

Suggestion to Online Schools for Kids. - Teach Kids the fun way of Trading, like a chess game.

There were 2 questions being posed  by the school to get an early sense of whether we would like to place our kid in the same online school or perhaps choose a physical school to attend to. They were also assessing and getting feedback of what they can possibly improve with the online schooling which had been done as a pilot project and a response of the Covid-19 situation.

The following are also what I sent to St. Isidore School were my kids had been taking online Schooling during this Covid-19 pandemic.

1. What have you/your child enjoyed about St. Isidore Online School?

Online Schooling allowed my kids to have more relaxed atmosphere, eg. not waking up very early and rushing to school. This is also the same with us parents since it took away from us the need of driving them to school and picking them up from school. Although, the challenge is to be able to assist them closely especially on technical stuff and comprehension element of classwork most especially, that they only have limited time with their teachers via classes and Student/Teacher connect.  

2. What suggestions/ideas do you have for us to consider when planning for the 2021-2022 school year at St. Isidore?

1. The only downside with the online schooling is that the interaction between the students had been limited. I have suggested this to one of the teachers that perhaps, there should be a time allocated for the students to have at least interaction and fun with them. If there is what we call Parent/Teacher connect, or Student/Teacher Connect, there should also be Student/Student Connect.

2. Being Musically minded, my kids had missed the opportunity to exhibit their musical talents since there is no more Talent Show conducted by the School. Our Lady of Grace before the end of School year last year, when pandemic had hit already, resorted to having the kids record their performances over flipgrid and the Music teacher collated all entries and made a single video presentation which had been shown to all as called "OLG Talent Show" in a specified date and time. The only concern I guess, is that the school (St. Isidore) still has a limited number of teachers handling the classes and have nobody having the expertise to do such thing. Maybe the school can start reaching out to gifted parents as well to volunteer. 

3. Master Classes have been an awesome add-on to the learning of the students. I just however would like to point out about Finance, Investing and Trading. This particular subject had not really been valued that much to parents and to teachers themselves. My kids, opted out when they saw this, because based on what they experienced previously is that they only learn how to save and not really the real aspects of trading, which they learned personally from me. We ought to raise our kids with the proper knowledge and experience to be able to handle well their own finances someday. But unless, we do this well, they will end just the same with the older generation relying heavily on working to make money alone instead of letting their money work hard for them. Schools should start assigning key individuals who can really execute this training to kids based on the experience and knowledge they had gained combining technical, fundamental and psychological aspects of Stock trading. One of the key thing here is to start creating some kind of curriculum that will address this thing just like any other art subjects.  Trading is also an Art, Science and a Psychological subject that when taught well to kids at an early age, it will equip them with superior ability to be able to understand well the market technically and fundamentally, read the market, act with cunning discipline as a business mogul, decide intellectually without sense of fear or greed on a given stock, commodity or ticker symbol. This will make them real masters in making their money to become Bishops, Queens, Horses, and Towers to follow a winning strategy to multiply their money even while they are sleeping or not working. If only the kids will be ushered to learn this thing in a fun way, like playing a chess game, then we can raise a lot of Stock Trading Masters, Savvy Businessmen and women, Disciplined Wizards and Wise Investors.  


Wednesday, January 20, 2021

What makes a better trader?

Learning to Trade is Hard...So what makes a Better Trader?


2 weeks ago I received a chat message from one, who was aspiring to become a trader. I encouraged him to start learning. And he started getting overjoyed with Bitcoins and the big possibility of gains he can possibly have. Yesterday he sent me another message saying:

Trading Field is like a dream that will never come true...wasted my 16 years on education...not able to devote time...I don't want to trade stocks.

Hello Jerome! Please have a look, what I created.

And I want to let you know something,
Yes, I am interested in this field of trading, as very interested, but I am struggling with learning because this field takes time and dedication, It definitely should be because it is a different field, a lot of competition out there, it seems like competing with them is a lot difficult.

I must say that the trading field is like a dream that will never come true,
because there is my family who depend on me, I have already wasted my 16 years on education, now my father is retired I am married too. so there are lot of responsibilities on me, i am not able to devote time to this field that's why i don't want to trade stocks, i heard people lose money there so i am not even able to take risks right now because i know that I will lose. because I haven't learned much.

But yes, I understand a lot of things in trading and now I can write some content. and able to do social media marketing in this field
So that is what, I wanted to share with you.
.

And please watch this video and let me know how it is.


Thank you very much

Cheers.


He created the a video out of the context I told him that Learning to Trade is Hard.
And here is his entry:

Learning to trade is hard...

So what makes a Better Trader?

Someone who had grit and determination
Someone who focuses on Long Term and isn't focus on the short term wins.

Learning to trade is hard
From Technical Charting to Fundamental Analysis of Stock
To finding a Guru or Forum that you can follow in order not to lose money.

But what if you could learn trading the easy way,

Without headache and without losing your hard earned money?

NOW YOU CAN WITH...
ACCELOTRADE.COM
(Peek. Practice. Play)


Just Peek, Practice and Play with other traders,
Artificial Intelligence or your invited guests
in a chess-like trading game.

Simple! NO books, No Guru, No forum and No headaches.

Start Accelotrading Today
Be a better trader tomorrow.

************ MY RESPONSE TO HIS MESSAGE****************

Hello my friend,

I like the video that you made. I will be commenting on each of those entries, but before doing so, I'd like to send you this message first, so that way you can be clarified.

So what makes a better trader?

This question is not answered on the next 2 lines you made.
You answered:
Someone who has grit and determination
Someone who focuses on Long Term and isn't focus on the short term wins
Determination is not enough to be a good trader. Time frame is not enough either.
If you think it's hard, you are right. And If you think it's simple you are also right.
Either way, you are right. If you think that education is a waste of time then it is. Because you made a decision to be what it is. And if you think you have no time to devote on something, then yes indeed. That is because you already made up also your mind to be that way.

So what makes a good trader?

What makes a good trader is his mind set.

Trading is an art and passion which can only be delivered with dedication and discipline. Dedication and Discipline happens only to guys who's mental toughness exceeds more than his feelings and emotions.

Trading is also finding your domain  of comfort. He has to choose which timeframe he is able to make a wise decision without being influenced by fear or greed or outside influence. Some are comfortable of pulling in and out at 1min trade, others are comfortable by the hour, others are pretty good at swinging on days but there are those wise guys too who excel in amassing multiple baggers of homeruns in long hauls. You have to choose which one. You cannot be expert on all time frames. If you have work on the side, you can maintain your work on the side and just use trading as a means to amass wealth in long hauls. 

How do you do such thing when you are tied with current work and duties that keep you busy? 

The Criteria:

It is simple.
You concentrate on 4 fundamental Criteria of choosing a company to place your money:

  1. a company that emerge to leadership
  2. a company with good management
  3. a company with increasing revenue and sales without debts
  4. a company with product that flies 

When you have these fundamentals, the technical chart is just your reference where you can possibly best position yourself. That is why I do not go with Forex or Bitcoins because they do not operate by fundamentals. Most of the time it is pure technical and plays of emotions. But if you master it, then you may do so. For those who want to continue their work and wants to make money by using their saved money, then go with the long hauls.

The Strategy:

Mark Minervini is one of the Stock Market Wizard and he advocated the use of some principles in selecting his stock. These are some of his principal points he used in what he termed SEPA Strategy. SEPA Strategy has 5 key elements to consider:

  1. TREND. Super performance stocks can be identified with the definite price uptrend.
  2. Fundamentals which I just discussed earlier. In the early stage the earnings and sales are on the table. Then in the Super performance phase the earnings, revenue and margins improved.
  3. Catalyst. Every super performance is ignited with catalyst behind it like new product development, new drug approval, which makes investors excited and drive the interest of Institutions.
  4. Entry Points. Timing the entry is very important, otherwise you get stopped out or else considerably miss a turn.
  5. Exit Points. Always consider profit. Identifying the end of the run is the key in order to keep what you made.

The Template:

Now this is the Trend Template he used to qualify stocks to fall into the trend he is looking for. These are the criteria that you can pick on a chart for a Super performance stock:

  1. Price is above 150SMA and 200SMA(Simple moving average)
  2. 150SMA is above 200SMA
  3. 200SMA is trending up for at least 1 month (preferably 4-5months)
  4. Price is above 50SMA
  5. Price is 30% or more above 52Week Low
  6. Price is 25% or less its 52Week High
  7. RSI(14) > 70 (80 or 90 is preferable)

The Chess Master and a Businessman:

If you are able to pin-point these in a stock then you basically have selected Bishops, Queens, Horses, Towers to move your money in working hard for you. You become the Chess Master. Alas, not all would become good, there are those also that might become pawns, thus, you need to establish discipline of disposing losing stock and never hold on to it believing it will come back. The fundamentals and technical will speak them for you. This is also where you need to establish up to what percentage are you comfortable of losing money based from your entry? 10%, 20%, 30%, 50%? Warren Buffet mentioned once, if you are not prepared to lose 50% of your investment, then you are not an investor. You do not need to be like Warren, that is why you need to choose which percentage are you comfortable with. If you are comfortable with 7%. Then go establish that discipline of really selling that losing position. Be comfortable with it. But if you really choose well in the beginning the right companies, then you are way to go in succeeding. It is like hiring the best employees for your own company. That is why trading is not gambling. It is a business. You are therefore a businessman. Treat it that way and you will succeed. Then even while you sleep and work your normal job, your money will continue to work for you. 

The Golden Rule...Richest Man in Babylon 

The golden rule of the "Richest man in Babylon", always keep 10% of your earnings. Spend whatever you want with the 90% but pay the 10% for yourself. Now this 10% you keep is what you will use to feed to those companies you have chosen to make more money for you. Practice this consistently while you are young then in your old age, you will have heck of a hefty rewards for your retirement. If you are turning towards the golden age. It is never too late if you set your mind to achieve something. Start peeking, practicing and playing with virtual money first in a chess-like trading game like accelotrade. When you feel you are ready, get those 10% you save and trade. But start something, visit accelotrade.com

Keeping that 10% takes discipline as well. So in the end, we go back to the same question. 

What makes a better trader? 

It's the mind set of one that makes him a better trader, a wise investor, a savvy business man, a chess master and a disciplined Wizard.


Friday, October 2, 2020

Trading New 78 Day High on 12Bars RSI above 60 after 200EMA Breakout

Trading New 78 Day High

after 200EMA Breakout, 12 Bars Price above 200EMA and 12Bars RSI 14 above 60.

In the quest of finding that quick move as well as taking profit in a short span of time while banking on the momentum of a stock I was able to find another pattern that when observed carefully could potentially give you a handsome profit. 

This is a Test on August 31, 2020 of EVGN which showed as one of the New 78 Day High on Stockfetcher. Please refer to my stockfetcher script on New 78 Day High on my previous blog "New 78 Day High Offset"

EVGN Daily Chart August 28, 2020
Fig. 1 "EVGN Daily Chart"

This is the chart of EVGN when it made it's New 78 Day High. Try to observe the points that had been numbered according to the Analysis. Better still if you open the image in a separate window so you can follow through the Analysis well.

ANALYSIS:

  1. Price B/O (Breakout) on 200EMA after 2 failed attempts on High Volume
    (see 1a and 1b failures).
  2. Price Retested on 200EMA. 
    NOTE 1: The Retest have an RSI above 60 
    NOTE 2: Price retest is not even touching the 200EMA
  3. 30EMA B/O or crossed above 200EMA
  4. B/O failure at 1.50 on August 14, 2020 and
    successful B/O at 2.50 on August 25, 2020.  
    NOTE: RSI on both Failed B/O and Successful B/O were all above 60 
                 This is a very bullish signal meaning that bullish momentum is really strong.
  5. B/O at 2.00 where the candle had formed an inverted hammer candle.
    NOTE: Observe well that the RSI of this candle is even very strong at 82.88
                 This simply means that the bulls are ready to take on beyond $2.00.
  6. The Price had always been above 200EMA for 12 bars. Observe well the price action within this span of time. It is creating a Supernova. This means that the price can still surge higher but may have a very strong pullback after. 

    Since #2 to #5 our bullish candle move had gone 5 bars already, we are going to Peggy back on the momentum of the last 3 bars until the 8th bar. Most significant move follows a rhythm of 8 bars before creating a strong pullback. 
  7. The RSI 14 of the price after the successful 200EMA B/O had been above 60 for 12 Bars. Observe well the RSI wave within this span of time. The wave is even climbing beyond RSI 80. This is highlighted with red rectangular box shaded with yellow.

TARGET CALCULATION

If I would go with my normal way of calculating the Target Price I will use my formula of calculating it. But since I am targeting of a 3 days trade only, I have to use a different approach. However, I will still lay down my formula calculation of the Target Price, so I will know the possible price it can go higher.

NORMAL Calculation of Target Price

TP = Target Price
PH = Previous High is at $1.50 when there was first attempt to breakout the 200EMA at #1a
VL = Volatility Low is at $0.75 the lowest low before the start of #1a breakout attempt.
BC = Breakout Close. This is BC2  at 1.66 after successful B/O at 1.50

TP = ((PH-VL)*3) + BC)
TP = ((1.5 - 0.75) * 3) + 1.50)
TP = 3.91 or $4.00

Based on our calculation, the stock can probably go up to $4.00. What we would like to see is make the most of the 3 days to follow after this New 78 Day High. The $4.00 can be good for a swing trade of another 12 to 15 bars.

Immediate Calculation of Target Price for the 3 bar trade.
Here we do not even have to calculate. 

  1. What I normally do is make an arrow from the close of the Breakout candle that successfully broke the 200EMA(See Fig. 2). 
  2. I stretch this arrow up to the High of the last candle on August 28, 2020. See H1 arrow with a height of 0.77.
  3. I clone this arrow (See Fig.3).
  4. then place the cloned arrow H2 on top of the H1 arrow (See Fig.3). 
  5. So if the cloned arrow starts at the New High of 2.10 which is the high of H1 arrow, this will end up a high of $2.87 (2.10 + 0.77).
  6. So your Target Price on the 3 bar trade will be $2.87 or $2.85 (See Fig.3).
 

Fig. 2 Creating the arrow from the close of the Breakout Candle at $1.33 
Fig. 3 Cloning the Arrow to use as H2 and get the Target Price

ENTRY

The New High had just broken the $2.00 Whole number resistance. Most of the time, after a price breaks out of this level, it will always retest what was broken before continuing higher. So if the price had gone to $2.10, chances are that the price would somehow retrace back to $2.00. With this in mind we will set our entry point at this whole number as our entry.

Entry = $2.00


TRADE CALCULATION:

MONEY = 2,000

SHARES = 1,000

BUY @ = 2.00

BUY AMOUNT = 2.00 * 1,000 = 2,000

TP = 2.85

TARGET AMOUNT = 1,000 * 2.85 = 2,850

PROFIT = 2,850 - 2,000 = 850.00

STOP LOSS = 1.85

LOSS AMOUNT = 1.85 * 1,000 =  1,850

TARGET LOSS = 2,000 - 1,850 = 150

With all the Analysis and Calculation we tried setting up the Trade using the Prediction and Measurement Tool of Tradingview and assume a trade based on our calculations. The following chart gives you the result. A target of $2.85 had been reached. A gain of  $0.85 from the entry of $2.00. A $850 profit in just 3 days of trade on 1,000 shares on an investment of $2,000. (See Fi. 4)

Fig. 4 Target Price of $2.85 had been reached 


Wednesday, September 30, 2020

Trading New 78 Day High on 20 days Price above 200EMA and RSI above 60

Trading New 78 Day High
after 200EMA Breakout, 20 days Price above 200EMA and 20 days RSI 14 above 60.

In the quest of finding that quick move as well as taking profit in a short span of time while banking on the momentum of a stock I was able to find this pattern that when observed carefully could potentially give you a handsome profit. 

This is a Test on June 26, 2020 of BLNK which showed as one of the New 78 Day High on Stockfetcher. Please refer to my stockfetcher script on New 78 Day High on my previous blog "New 78 Day High Offset"

BLNK Daily Chart June 26, 2020


This is the chart of BLNK when it made it's New 78 Day High. Try to observe the points that had been numbered according to the Analysis. Better still if you open the image in a separate window so you can follow through the Analysis well.

ANALYSIS:

  1. Price B/O on 200EMA 
  2. Price Retested on 200EMA
    NOTE: The Retest have RSI above 60 
  3. 30EMA B/O on 200EMA
  4. B/O and Retest on 2.50 Previous Failure Feb 10, 2020
    NOTE: Feb. 10, 2020 RSI below 60 on 2.50 Failure
                 Jun. 24, 2020 RSI above 60 on Retest of 2.50 
  5. B/O and Retest on 2.75 Previous Failure Feb. 26, 2020
    NOTE: Feb 26, 2020 RSI below 60 on 2.75 Failure
                 Jun 26, 2020 RSI above 60 on Retest of 2.75
  6. Price Above 200EMA for 20 days. Observe well the price action within this span of time.
  7. RSI 14 above 60 for 20 days. Observe well the RSI wave within this span of time. This is highlighted with red rectangular box shaded with yellow.


TARGET CALCULATION

TP = Target Price

PH = Previous High

VL = Volatility Low

BC = Breakout Close


TP = ((PH-VL)*3) + BC)

TP = ((2.75 - 1.25) * 3) + 3)

TP = 7.5


ENTRY

Find Previous High and use that as entry

In this case, previous high is at the tip of the Rickshaw candle on Feb 20, 2020

Entry = 3.35


TRADE CALCULATION:

MONEY = 2,000

SHARES = 597

BUY @ = 3.35

BUY AMOUNT = 3.35 * 597 = 1,999.95

TP = 7.5

TARGET AMOUNT = 597 * 7.5 = 4,477.5

PROFIT = 4,477.74 - 1,999.95 = 2,477.55

STOP LOSS = 2.75

LOSS AMOUNT = 2.75 * 597 =  1,641.75

TARGET LOSS = 1,999.95 - 1,641.75 = 358.20

With all the Analysis and Calculation we tried setting up the Trade using the Prediction and Measurement Tool of Tradingview and assume a trade based on our calculations. The following chart gives you the result. A target of $7.5 had been reached. A gain of  $4.15 from the entry of $3.35. A $2,477.55 profit in just 7 days of trade on 597 shares on an investment closed to $2,000.


Friday, August 28, 2020

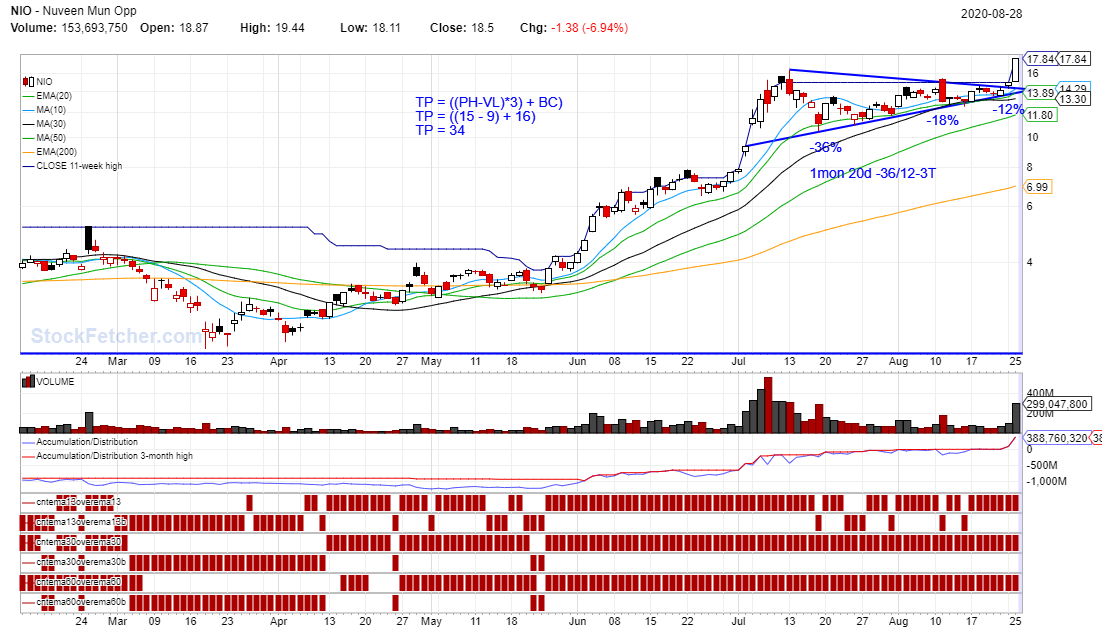
Understanding the NIO Trade - MINOLA New 55 Days High - $1000 Profit that went down to $400

Trading with NIO 

A $558 Profit that turned into just $200.00 profit.

The market has all the opportunity to make you money, but you need to be decisive when to fold so that you can profit as much as you can. When the opportunity arise of having a good profit, take it and keep it in your pocket. Do not wait until it is wiped out from the table by the market. I know this needs a lot of balancing of the pros and cons. 

Here is the scenario that needs to be understood well about the trade with NIO.

NIO had enjoyed a pretty good ride with the rise of TESLA

The Electric Vehicle Industry had been surging recently, especially with the leading innovator TESLA. March 19, 2020, TESLA was just trading between $358.00 and $452.00. This was during the lockdown time of Covid-19. But 5 months later TSLA surged to a high of $2,295.00. An explosive gain that made it number 1 on all Electric vehicle makers and even surpassing General Motors in capitalization by 9.6x. GM has a capitalization of 42.96B while TSLA had now reached a capitalization of $412.4B. No wonder GM is shifting its Corvette engineering team to its electric and autonomous vehicle programs. Tesla with its historic rise had also announced a 5:1 Stock Split in order to be able to make its stock price affordable for everyone. Another catalyst of its continuous upward move

Because of the rise of TESLA, all other electric vehicle manufacturers had enjoyed a good rise in stock values. These include NIO, FUV, NKLA, WKHS and even enticed new electric vehicle maker XPEV to make its IPO debut yesterday August 27, 2020.

NIO hitting New 55 Days high with a breakout on good volume.

March 19, 2020 NIO was just merely trading between $2.23 and $2.55. That was during the lock down on Covid-19 pandemic. July 13, 2020 when businesses had been opened again with social distancing, the stock had hit a new high of $16.44. An impressive 644% increase in value. After that rise, the stock pulled-back to a new low of $10.46 on July 17, 2020 and continued to oscillate its price in contracting pattern with volume diminishing. This was the so called VCP formation or Volume Contraction Pattern. This had gone for 1 month and 20 days since July 02, 2020 when it made its first Gap-up breaking out the high of $9.00.

The pattern 39d-36/12-3T was the reading of the VCP pattern before August 21, 2020. It simply means 39days of price contraction starting with -39% and currently sitting at -12% VCP in 3 touches of contraction. On August 21, 2020, it had actually made -9% in contraction which is pretty closed to around 5 to 7% of which most of the breakout occurs. Indeed by August 25, the breakout occurred with price breaking its previous high of $16.44 and reaching to a new high of $17.87, accompanied with a strong volume. 


How the formation was caught?

This formation was perfectly shown with our stockfetcher filter MINOLA with New 55 Days High.
MINOLA is a term that combines the system of Mark Minervini, William O'Neal and Larry William. Please see previous blog on MINOLA.

Entering the trade during the breakout.

Entering during the breakout on the last half of the trading session is a good strategy to have the trade to sleep over and pop in the morning. When you notice a brekout on the VCP formation like this, try entering on the last session of the day when most of the short sellers are actually being squeezed. 


NIO on the next day, August 26, 2020 made a gap-up which shoot its price to a new high of $20.97

While the buyers are so eager to purchase more shares of NIO, that would have been the time to collect most of the profit. But knowing that breakout like this could run several days more, hanging on with the shares would be locking in more profits, especially when all the news are favorable with the stock. There is a saying which goes "Buy the rumors and sell the news." While the good news had been flying like hotcakes, it was actually a good time to sell.

REVIEWING THE NEWS

The pop would have been a good ride. Most of the time the price would continue for several days based on the positive news. And here are the positive news of NIO that made it breakout its VCP formation.

  1. August 25, 2020 NIO had been upgraded from sell to neutral by the bearish UBS Analyst Paul Gong as the fundamentals of NIO had improved in Q2 of 2020 with a good guidance for Q3 of 2020. Its sales in Q2 of 2020 had also increased by 146.5% compared to Q2 of 2019. It had also surpassed the sales of Pandemic laden Q1 2020 by 177.6%. With this kind of news, you will surely have positive outlook from investors who are willing to bet on NIO.
  2. August 26, 2020 NIO soared to a new high after a bullish call from Morgan Stanley. Tim Hsiao made a target of $20.50 for NIO and the report continued to explain that NIO after securing a $1 billion investment from state owned Heifi, it had actually removed the risk of not having enough capital to sustain its production of next year due to its net loss and heavy capital consumption. The target was actually reached and NIO had made a new high of $20.97.  
  3.  NIO is enjoying its ride with the rise of TESLA stock. Having NIO as the next TSLA( Tesla, the leader in the electric vehicle design, quality, production, good management, revenue generation and sales). NIO had not achieved anything like TESLA yet but had made great production of SUVs that have similar technology as TSLA. Being a Chinese company, it can certainly offer at a cheaper price range with their electric vehicles. 
  4. August 20, 2020. NIO during the previous days had actually made a good incentive program for the buyers to make the purchasing of its EV a lot cheaper by launching battery as a subscription service. This innovative way can lower down the cost of acquiring the car compared to its standard package. If this incentive would click, this can certainly increase their sales. Look at #1 as it had been slowly pumping higher its sales. This is really big plus for NIO.
  5. With the plan of course to open more facilities in Europe, they are actually gearing up for more exposures and eventually sales. The only downside, is that they had been burning their cash massively with their production and they are in need of more capital in order to support their move. The company had a net loss of 43M in Q1 of 2020 compared to the gain of 42M Q1 of 2019. But they were able to turn things around in Q2 of 2020 when it had made 177.6%  more sales compared to Q1 of 2020. And they are getting much attention now in the market. They can certainly be the next TESLA or at least comparing to AMD and NVIDIA of Graphics Processing Unit manufacturing. Tesla is the NVDIA of EV while NIO is the AMD of EV. 
  6. The Q2 2020 result still need to be carried and surpassed in Q3 and Q4. This proof of revenue is what makes the pop to be short lived, as big time investors would like to make sure that it can deliver and have all the financial ammunition to propel its ascent. The news indeed fueled for a pop from the breakout high of $17.87 to a new high of $20.97. Entering at $17.25 during the start of the breakout would have been a nice profit of $3.72.  

  7.  Based on the strength of a breakout with a gap-up and a good volume, the run would have been a continuous upward move. Yet it stalled on the second day after the gap-up. This stall was actually triggered by the recent news that NIO is offering $1.5B more public offering to raise more money as a capital for their minority stake acquisition, research and development in autonomous driving, and global market development. They already have an injection from Heifi, the Chinese State owned firm which help NIO ease the burden of cash shortage. This new cash will enable them to research more on autonomous driving as well as acquire more stake of NIO China. 

    Despite the good intention, Big time investors do not really like to see this kind of things. So, the price of the stock most of the time would always fall. On the other hand, Capital investors would love to invest their money with companies that have great potentials. And NIO has the potential to compete with TSLA, so the capitalist would seize this opportunity. But, Capitalist would never like to buy the shares at a high price. Market Makers knew all these and would do all in their powers to basically shake the market to induce fear to other weak investors. Once these weaker hands get scared, they will all relinquish their shares to the Market Maker and Market maker will have a boot load of shares to offer to big time capitalist. Thus, we will see NIO shedding off its price in shorter time, but in the long run, will see Capitalists slowly accumulating shares of this stock. Others shares will be purchased by Morgan Stanley, China International Capital and Bank of America, who are the underwriters of this offering.
The 15min Chart of NIO showed 2 gap-downs after its Gap-UP. The first Gap-Down should have been the clue of the imminent change of direction. The price tried to close the first gap-down but could not breakout from it. It failed and it made another gap-down.
The entry we had @17.25 if sold at @20.30 after the first gap-down signal would have made a nice profit of $3.05. This would translate $915.00 on 300 shares. But letting the price slipped without analyzing what happened in the 15min chart the price had cracked down again for the second time, leaving no choice of disposing the shares @18.64. Instead of $3.05 profit it was cut into $1.39 profit translated into $417.00 profit only for the 300 shares. Greed can sometimes cloud our judgment in analyzing the stock chart. Always make sure to plan a counter attack on major signals. Breakdown is a serious signal and therefore should not be taken lightly. 15minute chart and other time frame like 5min chart are used in contracts with the 1 day chart for they provide the left and right mirrors of the stock highway. The trade was still profitable but half of the gain was taken back by the market. Good trader should not allow this to happen.

In the long term, this NIO can still be a good candidate for ore upside. An appropriate entry should be planned carefully by scribing a new VCP. 

For now, the price seemed to be closing the previous gap-up  @17.85. If might probably go down still. The best course of action is to let the market show its move and if its favorable, ride on the shoulders of the giant. If the ride is good for 2 days or just 1 day based on what you see on the chart, react accordingly and make sure not to give back the money to the market.  
 

Thursday, August 27, 2020

XPEV - XPENG VEHICLE - New IPO in EV who will be competing with TESLA

 A new Chinese company had just made its debut in stock exchange today. It is called XPENG, one of the leading Electric vehicle company in China who had done a lot of production in China is now entering the US Market for electrical vehicle offering to the public.

Brian Gu, who is the Vice Chairman and President is saying that they are waiting what Elon Musk could really show during the battery day, if battery power they touted about could really reach the Electric Vehicle to run a million mile before re-charging. 

https://finance.yahoo.com/news/we-are-watching-to-see-if-tesla-and-elon-musk-will-reveal-a-millionmile-battery-xpeng-ceo-171531166.html

XPENG in their website https://en.xiaopeng.com/

have two model vehicles they are posting as their highlighted flagships. So far the following youtube videos made a pretty good review and explanation of why XPENG cars are pretty much a good buy in terms of specs and technical advancement, of which may even be better than TESLA.

  1. G3 - Super Long Range Smart SUV


  2. P7 - Super Long Range Smart Sedan


And here's how it looked like in its 5min chart debut.


 XPEV open at $25.00 and get hammered down to $22.33 but was able to get back immediately to its high of $25.00 in just 3 sessions after its pullback. Yet from then on it just continued to slide downward to a low of $22.57 and kept hovering on that level. So far financially wise, this manufacturer will have to prove first its performance, sales and revenue and not just its fancy look and low price scheme. You can keep this stock on your watchlist for now but not yet in your portfolio.

Wednesday, August 12, 2020

AMD - huge run after VCP - $53.00 or 189% profit after a year

 Last Jul 5, 2019, I sent out an email about my analysis on AMD.

This was the content of that email.

  1. This AMD formation is the 3rd VCP from the Darvas Base of $16-$20 range. See Darvas Box (range: $16-$20)
  2. The Failed top of June 10, 2019 on $34.00 formed Double top against Sep. 13, 2019. Therefore you can expect the stock to retest key support levels before bouncing up against this $34.00 resistance.
  3. The possible key supports are the whole number $30.00 and $28.85 near the close of the 2 candles supported with 2 green big volumes. See circled supporting volumes and their corresponding candles.
  4. If you count the number of bars associated from previous breakout to breakout on the VCP, the count is consistent with 48 bars. See VCP 1, VCP 2. So if it follows the same pattern, we can deduce that around August 5, 2019, there is a possible breakout from VCP 3. I could be wrong, but that is a probability based on the pattern.  
  5. The entry range will be based on the retest of the top on each previous breakout. See again VCP 1 and VCP 2. All consecutive drop of candles stop just right about the high of each previous candle trying to penetrate from the bottom left side of each VCP triangle. See the blue arrows pointing upward. So the possible entry range will be between $28.85 to $30.00, which are the support levels in this case.
    WARNING: Make sure to calculate your profit target and your Stop Loss before entering a trade.
  6. A strong volume is needed to breakout the $34.00 resistance, otherwise it will continue to drop and retest again another key support before creating a triple top.
  7. If you enter on 28.85, make sure to place a stop loss at 27.50.
Check the chart I loaded up with my analysis. https://www.tradingview.com/x/d1kGZGUu/

Cheers and have a good one.


My advise at that time is to position around $28.85 to $30.00. Had you done so, you could have made around $53.00 profit.

Today is August 12, 2020 1 and a half after.
And here is the chart of AMD. 


TSLA - Tesla just made a 5 to 1 Split

Tesla during the early Feb 2020 had made a high of $968  which bottomed to a low of $350 during the lock-down because of Covid-19 pandemic. But since then it made all time high of $1794 around July 13, 2020 when some key businesses had been opened. The historic rise was also due to the fact that Electric vehicles had been hyped throughout all multi media channels adding the good revenue of Tesla and its turn around into massive production after the injection from the US government. Almost throughout the entire pandemic the talk of the day is about electric car and Tesla is the number 1 being talked about skyrocketing the value of the company with a capitalization of $264.37B making it 6.6 times greater than General Motors sitting at $40.042B. This made Elon Musk to become the 5th richest man in the world with a net worth of $74B surpassing Warren Buffet.

The catalyst of the its move was significantly due to the fact that it had surpassed the analyst prediction of Wall Street. During its 2nd quarter where in the analysts have predicted only a delivery of 20K vehicles, Tesla made a surprising delivery of 90K vehicles. Its loss of $1B last 2019 had now been a turn around of a net income of $197M. Musk had delivered despite all the negative criticism and oppositions from Wall Street itself and the Billionaires from the auto industries. Tesla has now become the leader in the electric vehicles and would even become the leader of the entire auto industry, if the rest of the other gas-fueled vehicle manufacturers could not make or compete with Tesla's dominance. It's giga factory for batteries that would enable its car to run not just 200miles before re-charging but run a million miles is phenomenal. Perhaps this breakthrough, would negate any other car manufacturers to take the lead as they are all falling behind now against Tesla.  

 And today, Tesla had just announced a 5:1 stock split which will enable its high price to be more affordable to retail investors and traders and even quintupling the shares of Big Fund managers and Insiders. It is currently sitting at $1,515.72 as of this writing. This maneuver by Elon Musk is a replica of what Apple had done with their high profile stock which had undergone a stock split to allow more buyers to take position. So if you buy 1 share at $1,500 of TSLA you will end up having 5 shares of $300.00/share. And most of the time, very good companies who makes a split would usually be able to carry the price again back to its former high after the split. Tesla has all the potential to do so when gas-fueled cars are later on going to be phased out against eco-friendly cars. And Tesla is even touted to probably hit $7,000/share. If you can position today or had already have a position, you are in for a bull ride.


Tuesday, August 4, 2020

AG - New 78 Day High - Breakout - Gap-Up - Doji - High Volume

AG
We look for 6 Clues:
  1. Price Breakout on 200MA
  2. Retesting or Re-Breakout of Price on 200MA
  3. 50MA Breakout above 200MA
  4. Volume Breakout against multiple volumes
  5. Gap-Up
  6. Doji Candle or Rickshaw Candle formation

AG Daily Chart - July 21, 2020


AG Daily Chart - Result after Gap-Up

EXK - New 78 Day High - Breakout - Gap-Up - Doji - High Volume

EXK 
We look for 6 Clues:
  1. Price Breakout on 200MA
  2. Retesting or Re-Breakout of Price on 200MA
  3. 50MA Breakout above 200MA
  4. Volume Breakout against multiple volumes
  5. Gap-Up
  6. Doji Candle or Rickshaw Candle formation
EXK Daily Chart - July 21, 2020

EXK Daily Chart - Result after Gap-Up

PSLV - New 78 Day High - Breakout - Gap-Up - Doji - High Volume

PSVL - Jul 21, 2020

PSLV - Daily Chart
PSLV - Weekly Chart


ANALYSIS:

RESULT


Thursday, July 30, 2020

SPPI - How to Profit on Price Volume Anomaly

SPPI

The scenario:
  1. Aug 10, 2016 Heavy Sell out from a high of 6.90 to a low of 5.61. Huge red candle and huge red volume amounting to 3.73M shares. 
  2. Price dipped to the low of 3.20. 
  3. Feb 10, 2017 Price broke out above 200ema but with small volume.
  4. Price continued to rise up to a high of 6.80 but got slapped back when it hits that SUPPLY 1 / RESISTANCE 1 level. This is the previous high when it dropped heavily last Aug. 10, 2016 with a volume of 3.73M.(See #1)
  5. It found support at 5.72 on a thin volume on Mar 9, 2017. This support is where the demand level is found. This is when the price broke out of the previous low of Aug, 10, 2016 on its large bearish candle. (See #1) 
  6. March 17, 2017 a huge volume came popping up but surprisingly with just a small candle. This is our first Anomaly.
  7. April 20, 2017 Price breaks out of 6.80 with a bit of volume at 1.75M, but not enough as to break out the 3.73M of Aug. 10, 2016. If this would be a true breakout, the breakout volume (B/O Vol) should exceed the red Drop Volume (Drop Vol) of Aug. 10, 2016. This is the second anomaly. The breakout may run only for few days just to hit RESISTANCE 2 or SUPPLY 2, the previous high at 7.65. Smart Money is not buying at this level yet. 
  8. We created a Channel by connecting all the Highs and the Lows of SPPI starting from its lowest low. (See Upper and Lower Channel). We expect a resistance at at Supply 2 level around 7.65. Rounding this to quarters, the resistance would be around 7.75, which could rest just right at the upper channel. Since the Smart Money is not buying at this level, Market Maker will be forced to shake the tree and create a scare or sting to the retail investors and collect again the shares for the possible heavy demand of Smart Money at a Retest Level.
  9. Possible level Smart Money are waiting for a retest. 

How to profit on this run.

  1. Since we know that there are anomalies of the bullies volumes and candles, we could say that the bullish run from the breakout might last only for few days and get slapped at Supply 2. Entering at 7.00 and putting at stop 25cent below it with a profit target up to Supply 2 / Resistance 2.
  2. We will reverse our move once we see a triple top at 7.75 and short the stock with a target on the Retest Level. 
  3. We can also avoid #2 if you do not like shorting stock. You can join the Smart Money in buying wholesale at RETEST LEVEL.


Setting up the trading game with Accelotrade:
Go to accelotrade.com and create your game to test your ability in trading this scenario. If you haven't have any account yet with Accelotrade, just register, it is for free right now. 

Here is the setting when creating the game:
We are creating 2 games here.
  1. SPPI_JRTraders_PriceVolAnomaly_01 (30days, April 20, 2017
  2. SPPI_JRTraders_PriceVolAnomaly_02 (130 days, May 20, 2017)


Tuesday, July 28, 2020

Winning Patterns on Weekly Charts + Bullish Engulfing Candle with N Pattern

SOLAREDGE
SEDG

OESX - Orion Energy Ord

THE N PATTERN After Bullish Engulfing Candle with huge Volume
RVP Made a New 78 Day High last May 4, 2020. It made new high again for 6 days but failed to hold it. Nevertheless, it pulled back just slightly above the mid section of its breakout candle and breaks out of the high of May 4, 2020. The pattern of its move showed an italic letter "N". After that pattern, Price kept going upward despite low volume. The Big guns are slowly acquiring position in smaller quantities, distributing their buys in succeeding days. 


RVP on July 27, 2020 exhibited some kind of abnormality in its price action. This could be a signal of something about to reverse. This is an exit signal. The big guys are not supporting anymore with the move. The price is being moved by just the retail investors, small time traders who are late into the game. Upper channel is also reached. 


RVP made New 78 Day High on April 8, 2020 with a bullish engulfing candle breaking out the failed high at $1.74 when it had a volume of more 3,757% from its normal daily volume last March 30, 2020. 
That March 30, 2020 was a first attempt to breakout at 1.74 but failed due to presence of many sellers. The high volume though represented a very strong interest of the stock. Price pulled back lower than the low of that March 30, 2020 breakout candle. Now if you trace the formation from March 30, 2020 to April 8, 2020 a letter "N" formation occurred. The candle is also accompanied with volume higher than the red volume which caused a down day on March 31, 2020.


 In 17 days, the target of 3.86 had been captured and price went even more to $5.00 on May 4, 2020. The volume had surged again for another 350% on top of the volume that made a significant rise of 3,757% on March 30, 2020. 


Monday, July 20, 2020

The Secret to Following all Stocks by Larry William using Comparative Strength. Study on SVM, LIFE, RADA, and SNAP, BLFS, FUV

SPOTTING ACCUMULATION
"To spot professional accumulation, all we need to do is find an example of steady and determined buying in the face of a weak stock market. When this happens we have a good idea that professional buying is taking place." (The Secret of Selecting Stocks for Immediate and Substantial Gains", by Larry Williams, p. 14)

SPOTTING DISTRIBUTION
"Professional Selling will show up when we see consistent and determined selling in the face of a strong market. When the Market is surging, but selling pressures enter a particular stock, we can bet that we have a stock undergoing professional, informed selling." (The Secret of Selecting Stocks for Immediate and Substantial Gains", by Larry Williams, p. 14)

COMBINING IT WITH STOCK CHART
ACCUMULATION DETECTION
Look for Bullish Divergence. When a stock fails to be severely affected by the selling pressure of the overall market, then there is Bullish Divergence. The bullish divergence of the stock is when it goes against the overall selling market direction and rally heavily upward when the overall market is trending higher.


BELOW IS A COMPARISON OF LIFE AND NASDAQ
NASDAQ INDEX - 2020/07/20


FUV - 2020/07/20


LIFE VS NASDAQ
There is a small activity going on with LIFE but the volume seemed not to be supporting it. Maybe this is the beginning or is waiting for another pull-back before Volume comes in.

SVM VS NASDAQ
SVM is rallying strongly higher than NASDAQ
SVM vs DOW
SVM is showing strong divergence upward against falling DOW Jones

SVM by itself


SNAP VS NASDAQ AND DOW JONES

SNAP 2020/07/20
If you see the chart carefully, SNAP is outpacing the upward strength of NASDAQ in orange line and diverging upward against the downward strength of DOW Jones in purple line. By Larry William's theory, this stock is under accumulation.

Based on Volume and Price Action Analysis, there are 2 huge red days but very small volume noticeable with SNAP. These were June 26, 2020 and Jul 16, 2020. SNAP had actually just broken out its previous high of $24.00 from its Debut day. It had now broken $25.00. If it holds on $25.00 or at least hold on its $24.00 support then this stock will continue to rise. 

RADA VS NASDAQ AND DOW Jones
RADA 2020/07/20 VS DOW & NASDAQ

RADA 2020/07/20 Volume-Price-Action

RADA against DOW is clearly exhibiting strong divergence upward against DOW's (in purple) direction. And comparing it with NASDAQ, it had shown aggressive upward move with much volatility against NASDAQ's rising price action.

Looking at the Volume Price Action Chart of RADA, it had experienced double top around $6.50 that is why it could not hold the price there and it had to come falling down. There are however 2 huge volume support which come from Sep 16, 2019 and Jan 06, 2020 which are waiting to hold the price at around $5.83. If the price does not break down $5.50 then we will have a potential for continuation of its move upward.

 
BLFS VS NASDAQ and DOW JONES
BLFS 2020/07/20 VS DOW JONES

BLFS 2020/07/20 VS NASDAQ


BLFS 2020/07/20 Breakout on Previous High

Against Dow Jones, it is clearly seen that BLFS is showing strong divergence going upward while DOW Jones was merely trading on range. If we check how it fared against NASDAQ, it basically showed a strong upward move that is a lot stronger than NASDAQ's rise. And what is so noticeable is that the strong move upward is supported with huge volume as well. This is really accumulation.

This is the calculation we had with the kids when we reviewed BLFS last 2020/07/02
TP = Target Price
PH = Previous High
VL = Volatility Low

TP = ((PH-VL)*3)+BC)
TP = ((17.29 - 11) * 3) + 18.96
TP = 37.83

1ST PULL @ 20
2nd PULL @ 27
3RD PULL @ 37.83
ENTRY RANGE: 15.30 to 17.30

At the current move this entry has not been materialized. We should have moved the entry closer to the close of 17.98 when it had the huge candle on July 2, 2020 backed with heavy volume of 3.7M compared to the normal volume of between 100-400M shares.


More on Different kind of Trading: Vol High - Prior Vol High Stock Entry - Case on CONL (Granite Shares Trust Granite Shares 2x LON)

CHART: CONL (Granite Shares Trust Granite Shares 2x LON) http://charts.stockfetcher.com/sfchart/OeSm5wo7tZ.png https://www.tradingview.com/x...